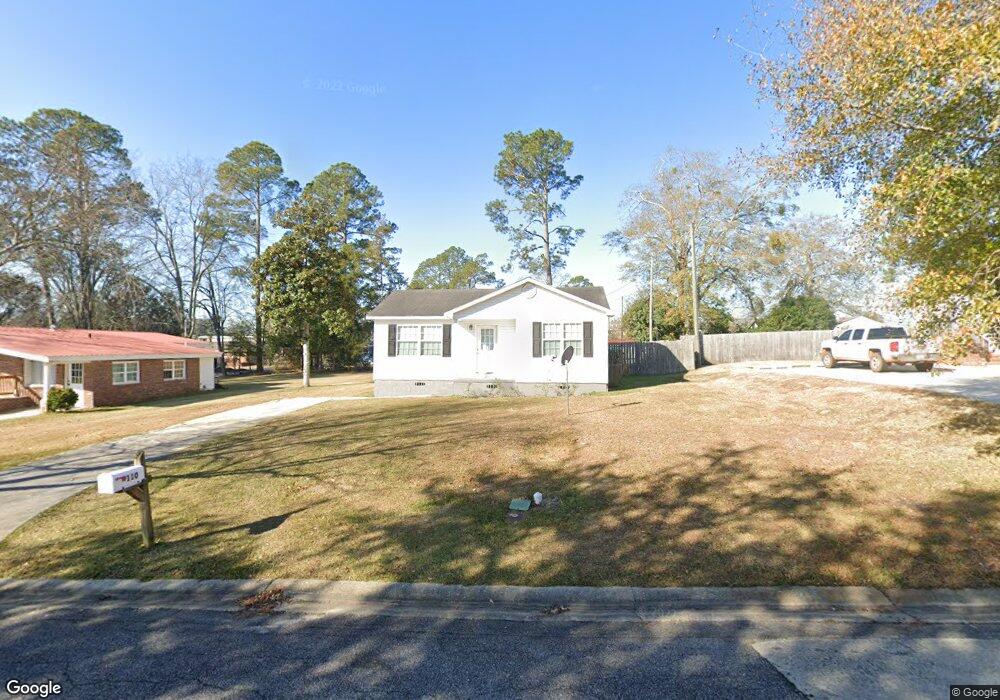
110 9th St SE Moultrie, GA 31768
Estimated Value: $117,161 - $160,000
--
Bed
1
Bath
896
Sq Ft
$159/Sq Ft
Est. Value
About This Home
This home is located at 110 9th St SE, Moultrie, GA 31768 and is currently estimated at $142,540, approximately $159 per square foot. 110 9th St SE is a home located in Colquitt County with nearby schools including Cox Elementary School, Willie J. Williams Middle School, and C.A. Gray Junior High School.
Ownership History
Date
Name
Owned For
Owner Type
Purchase Details
Closed on
May 11, 2011
Sold by
Wilson Silas R
Bought by
Corrales Juan Souza and Vega Jezarela Sisinta
Current Estimated Value
Home Financials for this Owner
Home Financials are based on the most recent Mortgage that was taken out on this home.
Original Mortgage
$58,030
Outstanding Balance
$40,550
Interest Rate
5%
Mortgage Type
Future Advance Clause Open End Mortgage
Estimated Equity
$101,990
Purchase Details
Closed on
Oct 29, 2010
Sold by
Sorrell Lillian Branan Crosby
Bought by
Wilson Silas R
Purchase Details
Closed on
Aug 22, 2010
Sold by
Crosby Carolyn
Bought by
Crosby Carey Evan
Purchase Details
Closed on
Jul 22, 2010
Sold by
Crosby Scottie
Bought by
Crosby Carey Evan
Purchase Details
Closed on
Jul 16, 2010
Sold by
Crosby James
Bought by
Crosby Carey Evan
Create a Home Valuation Report for This Property
The Home Valuation Report is an in-depth analysis detailing your home's value as well as a comparison with similar homes in the area
Home Values in the Area
Average Home Value in this Area
Purchase History
| Date | Buyer | Sale Price | Title Company |
|---|---|---|---|
| Corrales Juan Souza | $65,000 | -- | |
| Wilson Silas R | $13,000 | -- | |
| Crosby Carey Evan | -- | -- | |
| Crosby Carey Evan | -- | -- | |
| Crosby Carey Evan | -- | -- | |
| Crosby Carey Evan | -- | -- |
Source: Public Records
Mortgage History
| Date | Status | Borrower | Loan Amount |
|---|---|---|---|
| Open | Corrales Juan Souza | $58,030 |
Source: Public Records
Tax History Compared to Growth
Tax History
| Year | Tax Paid | Tax Assessment Tax Assessment Total Assessment is a certain percentage of the fair market value that is determined by local assessors to be the total taxable value of land and additions on the property. | Land | Improvement |
|---|---|---|---|---|
| 2024 | $1,045 | $42,318 | $1,350 | $40,968 |
| 2023 | $1,233 | $33,458 | $1,350 | $32,108 |
| 2022 | $962 | $30,254 | $1,350 | $28,904 |
| 2021 | $937 | $29,151 | $1,350 | $27,801 |
| 2020 | $838 | $25,819 | $1,350 | $24,469 |
| 2019 | $944 | $25,827 | $1,350 | $24,477 |
| 2018 | $1,031 | $25,827 | $1,350 | $24,477 |
| 2017 | $935 | $25,827 | $1,350 | $24,477 |
| 2016 | $977 | $25,827 | $1,350 | $24,477 |
| 2015 | $980 | $25,827 | $1,350 | $24,477 |
| 2014 | $1,003 | $25,827 | $1,350 | $24,477 |
| 2013 | -- | $25,827 | $1,350 | $24,477 |
Source: Public Records
Map
Nearby Homes
- 619 E Central Ave
- 717 5th Ave SE
- 407 1st Ave SE
- 521 5th Ave SE Unit 4
- 515 5th Ave SE Unit 4
- 1013 6th Ave SE
- 1406 3rd Ave SE
- 600 1st St SE
- 1021 11th Ave SE
- 902 2nd St SE
- 1117 11th Ave SE
- 310 1st Ave SW
- 209 7th Ave SW
- 1716 5th Ave SE
- 503 2nd St NW
- 615 1st St NW
- 704 3rd St SW
- 00 1st Ave SW
- 118 5th St SW
- 221 6th St SW
- 114 9th St SE
- 111 8th St SE
- 115 8th St SE
- 804 1st Ave SE
- 114 8th St SE
- 805 1st Ave SW
- 116 8th St SE
- 901 1st Ave SE
- 905 1st Ave SE
- 111 7th St SE
- 115 7th St SE
- 826 E Central Ave
- 117 7th St SE
- 911 1st Ave SE
- 812 E Central Ave
- 830 E Central Ave
- 817 E Central Ave
- 811 E Central Ave
- 805 E Central Ave
- 825 E Central Ave