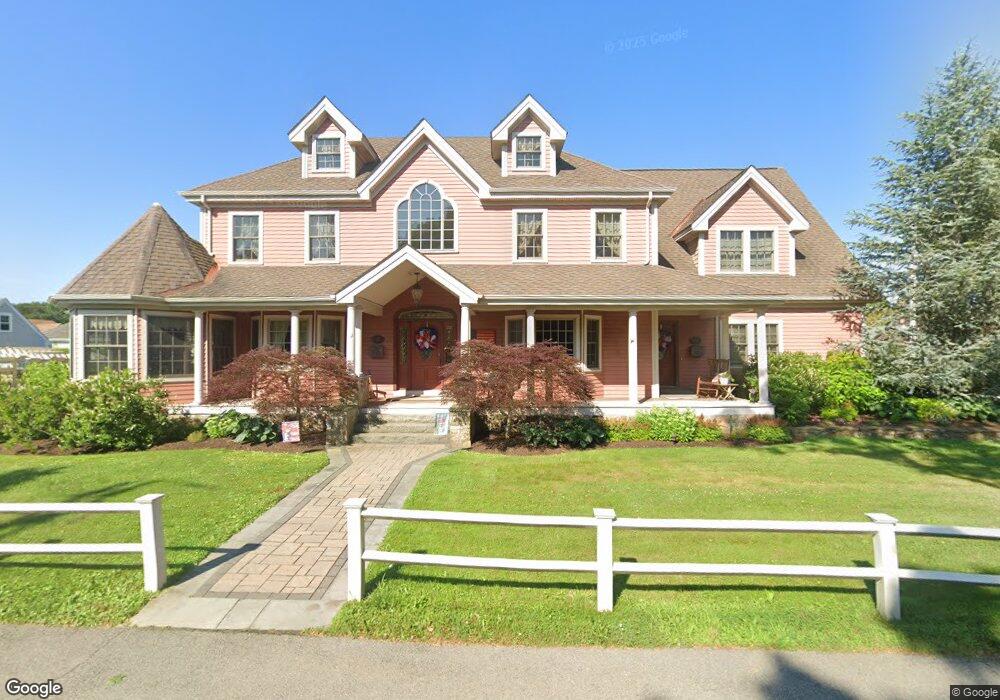
110 Adams St Unit 112 Fairhaven, MA 02719
Oxford NeighborhoodEstimated Value: $1,241,000 - $1,822,000
5
Beds
5
Baths
8,631
Sq Ft
$172/Sq Ft
Est. Value
About This Home
This home is located at 110 Adams St Unit 112, Fairhaven, MA 02719 and is currently estimated at $1,483,442, approximately $171 per square foot. 110 Adams St Unit 112 is a home located in Bristol County with nearby schools including Fairhaven High School, City On A Hill Charter Public School New Bedford, and St. Joseph School.
Ownership History
Date
Name
Owned For
Owner Type
Purchase Details
Closed on
Feb 24, 2016
Sold by
Melanson Cathy J
Bought by
Melanson Kenneth A
Current Estimated Value
Home Financials for this Owner
Home Financials are based on the most recent Mortgage that was taken out on this home.
Original Mortgage
$600,000
Outstanding Balance
$479,115
Interest Rate
3.92%
Mortgage Type
Purchase Money Mortgage
Estimated Equity
$1,004,327
Create a Home Valuation Report for This Property
The Home Valuation Report is an in-depth analysis detailing your home's value as well as a comparison with similar homes in the area
Home Values in the Area
Average Home Value in this Area
Purchase History
| Date | Buyer | Sale Price | Title Company |
|---|---|---|---|
| Melanson Kenneth A | -- | -- |
Source: Public Records
Mortgage History
| Date | Status | Borrower | Loan Amount |
|---|---|---|---|
| Open | Melanson Kenneth A | $600,000 |
Source: Public Records
Tax History Compared to Growth
Tax History
| Year | Tax Paid | Tax Assessment Tax Assessment Total Assessment is a certain percentage of the fair market value that is determined by local assessors to be the total taxable value of land and additions on the property. | Land | Improvement |
|---|---|---|---|---|
| 2025 | $12,781 | $1,371,300 | $180,500 | $1,190,800 |
| 2024 | $12,231 | $1,325,100 | $180,500 | $1,144,600 |
| 2023 | $12,347 | $1,240,900 | $158,300 | $1,082,600 |
| 2022 | $11,737 | $1,148,400 | $147,200 | $1,001,200 |
| 2021 | $12,438 | $1,101,700 | $133,300 | $968,400 |
| 2020 | $12,185 | $1,101,700 | $133,300 | $968,400 |
| 2019 | $13,004 | $1,114,300 | $110,800 | $1,003,500 |
| 2018 | $12,711 | $1,081,800 | $105,600 | $976,200 |
| 2017 | $12,659 | $1,051,400 | $105,600 | $945,800 |
| 2016 | $11,790 | $968,000 | $105,600 | $862,400 |
| 2015 | $12,725 | $1,047,300 | $105,600 | $941,700 |
Source: Public Records
Map
Nearby Homes