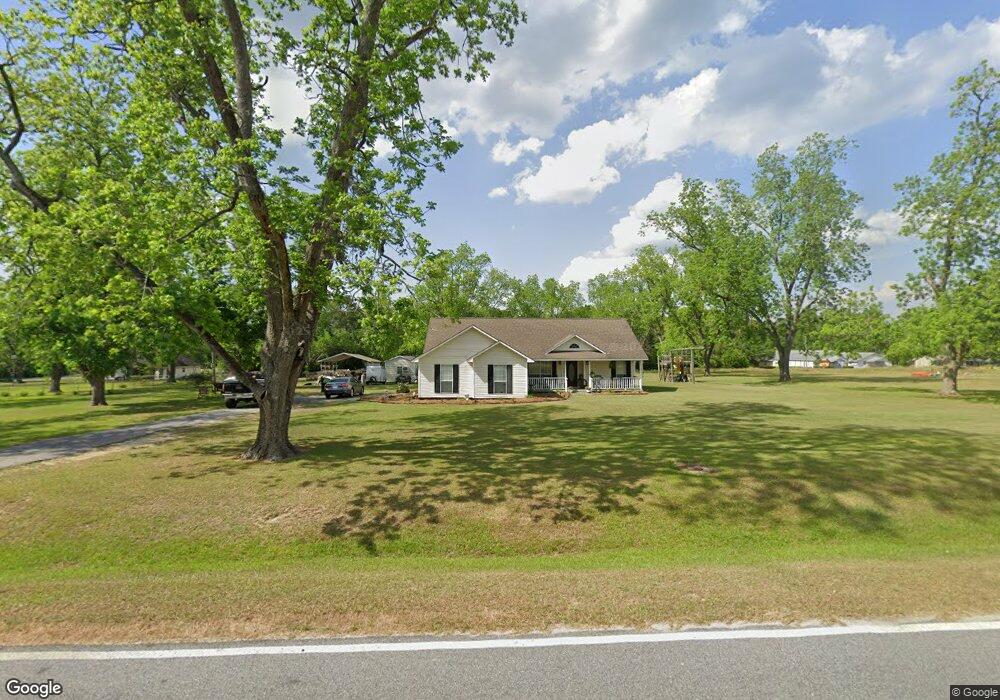
110 Agner Ct Fitzgerald, GA 31750
Estimated Value: $140,000 - $184,558
3
Beds
2
Baths
1,511
Sq Ft
$112/Sq Ft
Est. Value
About This Home
This home is located at 110 Agner Ct, Fitzgerald, GA 31750 and is currently estimated at $169,640, approximately $112 per square foot. 110 Agner Ct is a home located in Ben Hill County with nearby schools including Ben Hill County Primary School, Ben Hill Elementary School, and Ben Hill County Middle School.
Ownership History
Date
Name
Owned For
Owner Type
Purchase Details
Closed on
Oct 2, 2009
Sold by
Brown Amanda D
Bought by
Clements William A
Current Estimated Value
Home Financials for this Owner
Home Financials are based on the most recent Mortgage that was taken out on this home.
Original Mortgage
$103,570
Outstanding Balance
$56,231
Interest Rate
5.05%
Mortgage Type
New Conventional
Estimated Equity
$113,409
Purchase Details
Closed on
Apr 4, 2003
Sold by
Summa Builders Inc
Bought by
Brown Amanda D
Purchase Details
Closed on
Jun 11, 2002
Sold by
Tolleson Land and Tolleson Timb
Bought by
Summa Builders Inc
Purchase Details
Closed on
Oct 30, 1996
Bought by
Tolleson Land and Tolleson Timb
Create a Home Valuation Report for This Property
The Home Valuation Report is an in-depth analysis detailing your home's value as well as a comparison with similar homes in the area
Purchase History
| Date | Buyer | Sale Price | Title Company |
|---|---|---|---|
| Clements William A | $101,500 | -- | |
| Brown Amanda D | $73,800 | -- | |
| Summa Builders Inc | $7,300 | -- | |
| Tolleson Land | -- | -- |
Source: Public Records
Mortgage History
| Date | Status | Borrower | Loan Amount |
|---|---|---|---|
| Open | Clements William A | $103,570 |
Source: Public Records
Tax History
| Year | Tax Paid | Tax Assessment Tax Assessment Total Assessment is a certain percentage of the fair market value that is determined by local assessors to be the total taxable value of land and additions on the property. | Land | Improvement |
|---|---|---|---|---|
| 2024 | $1,568 | $57,147 | $3,400 | $53,747 |
| 2023 | $956 | $55,169 | $3,400 | $51,769 |
| 2022 | $1,382 | $47,773 | $3,400 | $44,373 |
| 2021 | $1,250 | $42,368 | $3,400 | $38,968 |
| 2020 | $1,259 | $42,212 | $3,400 | $38,812 |
| 2019 | $1,254 | $42,212 | $3,400 | $38,812 |
| 2018 | $1,386 | $41,899 | $3,400 | $38,499 |
| 2017 | $1,238 | $41,586 | $3,400 | $38,186 |
| 2016 | $1,173 | $41,285 | $3,400 | $37,885 |
| 2015 | -- | $40,968 | $3,400 | $37,568 |
| 2014 | -- | $41,729 | $3,400 | $38,329 |
Source: Public Records
Map
Nearby Homes
- 121 Thompson St
- 118 Flint St
- 229 Hudson Rd
- 209 E Ohoopee St
- 155 Grove Ave
- 306 S Monitor Dr
- 00 East Rd
- 0 Jacksonville Hwy Unit 141262
- 114 Taylor Cir
- 815 E Jessamine St
- 196 Wilson Ave
- 503 N Main St
- 124 N Main Street Extension
- 117 Royal Cir
- 616 N Main St
- 0 E Magnolia St
- 411 S Meade St
- 107 Lobingier Ave
- 0 Union Cemetery Rd Unit 20524152
- 303 W Altamaha St
Your Personal Tour Guide
Ask me questions while you tour the home.