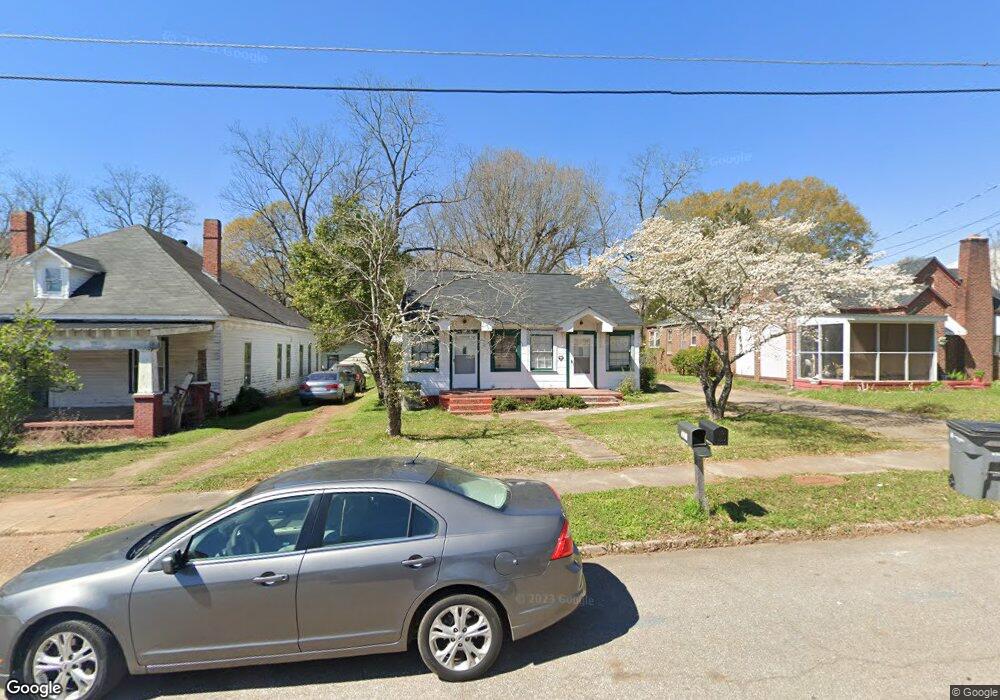
110 Alford St Lagrange, GA 30240
Estimated Value: $125,000 - $156,000
4
Beds
2
Baths
1,440
Sq Ft
$96/Sq Ft
Est. Value
About This Home
This home is located at 110 Alford St, Lagrange, GA 30240 and is currently estimated at $138,667, approximately $96 per square foot. 110 Alford St is a home located in Troup County with nearby schools including Hollis Hand Elementary School, Ethel W. Kight Elementary School, and Franklin Forest Elementary School.
Ownership History
Date
Name
Owned For
Owner Type
Purchase Details
Closed on
Mar 17, 2006
Sold by
Schweizer Robert W
Bought by
Lewis Anthony S
Current Estimated Value
Purchase Details
Closed on
Jul 12, 2001
Sold by
Rd Davis and Rd Nancy
Bought by
Robert W Schweizer
Purchase Details
Closed on
May 15, 2001
Sold by
Melanie Newman Davis
Bought by
Rd Davis and Rd Nancy
Purchase Details
Closed on
Jan 11, 2001
Sold by
Charles Edward Davis
Bought by
Melanie Newman Davis
Purchase Details
Closed on
Dec 12, 2000
Bought by
Charles Edward Davis
Purchase Details
Closed on
Nov 10, 1998
Sold by
Davis R D
Purchase Details
Closed on
Mar 20, 1984
Sold by
Moss Martin A and Mcdaniel Allen
Bought by
Davis R D
Purchase Details
Closed on
Mar 19, 1984
Sold by
Prince Frank
Bought by
Moss Martin A and Mcdaniel Allen
Purchase Details
Closed on
Jan 1, 1981
Bought by
Prince Frank
Create a Home Valuation Report for This Property
The Home Valuation Report is an in-depth analysis detailing your home's value as well as a comparison with similar homes in the area
Purchase History
| Date | Buyer | Sale Price | Title Company |
|---|---|---|---|
| Lewis Anthony S | $66,000 | -- | |
| Robert W Schweizer | $54,000 | -- | |
| Rd Davis | -- | -- | |
| Melanie Newman Davis | -- | -- | |
| Charles Edward Davis | -- | -- | |
| -- | -- | -- | |
| Davis R D | $70,000 | -- | |
| Moss Martin A | -- | -- | |
| Prince Frank | -- | -- |
Source: Public Records
Tax History
| Year | Tax Paid | Tax Assessment Tax Assessment Total Assessment is a certain percentage of the fair market value that is determined by local assessors to be the total taxable value of land and additions on the property. | Land | Improvement |
|---|---|---|---|---|
| 2025 | $909 | $33,320 | $3,320 | $30,000 |
| 2024 | $881 | $32,320 | $3,320 | $29,000 |
| 2023 | $832 | $30,520 | $3,320 | $27,200 |
| 2022 | $687 | $28,960 | $3,320 | $25,640 |
| 2021 | $579 | $19,200 | $3,320 | $15,880 |
| 2020 | $570 | $18,888 | $3,320 | $15,568 |
| 2019 | $511 | $16,928 | $3,320 | $13,608 |
| 2018 | $501 | $16,608 | $3,000 | $13,608 |
| 2017 | $501 | $16,608 | $3,000 | $13,608 |
| 2016 | $489 | $16,220 | $3,000 | $13,220 |
| 2015 | $501 | $16,570 | $3,350 | $13,220 |
| 2014 | $480 | $15,875 | $3,350 | $12,525 |
| 2013 | -- | $16,974 | $3,350 | $13,624 |
Source: Public Records
Map
Nearby Homes
- 208 Boulevard
- 405 W Broome St Unit 2
- 405 W Broome St Unit 3
- 405 W Broome St Unit 4
- 405 W Broome St Unit 1
- 405 W Broome St Unit 5
- 304 Boulevard
- 119 College Ave
- 206 Broad St
- 416 Park Ave
- 421 College Ave
- 598 Edmondson Ave
- 505 S Lewis St
- 509 S Lewis St
- 203 Waverly Way
- 207 Wilkes St
- 105 Saynor Cir
- 206 Peachtree St
- 200 Peachtree St
- 120 Saynor Cir
Your Personal Tour Guide
Ask me questions while you tour the home.