Estimated Value: $307,832 - $321,000
2
Beds
3
Baths
1,180
Sq Ft
$265/Sq Ft
Est. Value
About This Home
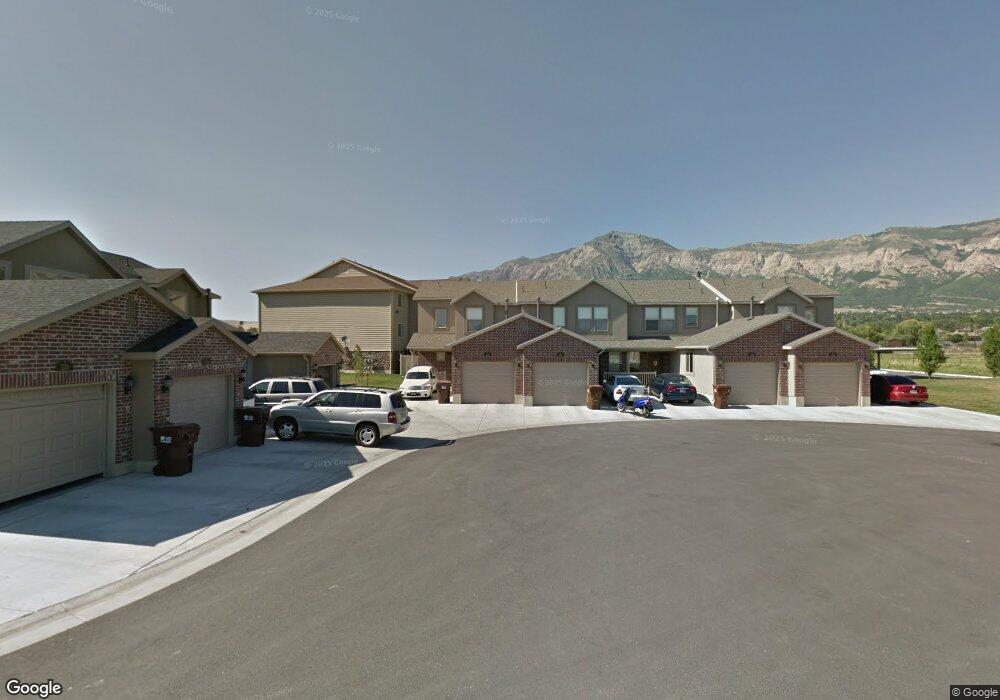
This home is located at 110 Arlington Way Unit 167, Ogden, UT 84414 and is currently estimated at $312,458, approximately $264 per square foot. 110 Arlington Way Unit 167 is a home located in Weber County with nearby schools including Majestic Elementary School, Orion Junior High School, and Weber High School.
Ownership History
Date
Name
Owned For
Owner Type
Purchase Details
Closed on
Aug 16, 2018
Sold by
Lehne Joshua
Bought by
Rios David Arthur
Current Estimated Value
Home Financials for this Owner
Home Financials are based on the most recent Mortgage that was taken out on this home.
Original Mortgage
$175,698
Outstanding Balance
$152,587
Interest Rate
4.5%
Mortgage Type
VA
Estimated Equity
$159,871
Purchase Details
Closed on
Apr 8, 2011
Sold by
Destination Homes Inc
Bought by
Lones Broc
Home Financials for this Owner
Home Financials are based on the most recent Mortgage that was taken out on this home.
Original Mortgage
$116,860
Interest Rate
5.4%
Mortgage Type
FHA
Purchase Details
Closed on
Aug 3, 2010
Sold by
Discovery Development Llc
Bought by
Destination Homes Inc
Home Financials for this Owner
Home Financials are based on the most recent Mortgage that was taken out on this home.
Original Mortgage
$415,680
Interest Rate
4.65%
Mortgage Type
Future Advance Clause Open End Mortgage
Create a Home Valuation Report for This Property
The Home Valuation Report is an in-depth analysis detailing your home's value as well as a comparison with similar homes in the area
Home Values in the Area
Average Home Value in this Area
Purchase History
| Date | Buyer | Sale Price | Title Company |
|---|---|---|---|
| Rios David Arthur | -- | Vanguard Title Ins Agency | |
| Lones Broc | -- | Bonneville Superior Title Co | |
| Destination Homes Inc | -- | Accommodation |
Source: Public Records
Mortgage History
| Date | Status | Borrower | Loan Amount |
|---|---|---|---|
| Open | Rios David Arthur | $175,698 | |
| Previous Owner | Lones Broc | $116,860 | |
| Previous Owner | Destination Homes Inc | $415,680 |
Source: Public Records
Tax History Compared to Growth
Tax History
| Year | Tax Paid | Tax Assessment Tax Assessment Total Assessment is a certain percentage of the fair market value that is determined by local assessors to be the total taxable value of land and additions on the property. | Land | Improvement |
|---|---|---|---|---|
| 2025 | $198 | $319,975 | $75,000 | $244,975 |
| 2024 | $68 | $172,700 | $41,250 | $131,450 |
| 2023 | $1,948 | $169,400 | $41,250 | $128,150 |
| 2022 | $1,958 | $173,250 | $41,250 | $132,000 |
| 2021 | $1,413 | $231,000 | $45,000 | $186,000 |
| 2020 | $1,360 | $206,000 | $30,000 | $176,000 |
| 2019 | $1,220 | $175,000 | $25,000 | $150,000 |
| 2018 | $1,151 | $158,000 | $23,000 | $135,000 |
| 2017 | $1,027 | $133,000 | $21,000 | $112,000 |
| 2016 | $950 | $66,550 | $11,550 | $55,000 |
| 2015 | $914 | $64,350 | $11,550 | $52,800 |
| 2014 | $866 | $59,950 | $11,550 | $48,400 |
Source: Public Records
Map
Nearby Homes
- 2448 Wellington Dr
- 121 Arlington Way
- 157 Arlington Way
- 145 W 2525 N
- 2393 Wellington Dr
- 2474 N Dorchester Ave
- 255 W 2700 N Unit 51
- 255 W 2700 N Unit 31
- 2517 N Dorchester Ave
- 205 E 2300 N Unit 63
- 225 E 2300 N
- 1260 N 350 W Unit 160
- 1272 N 350 W Unit 158
- 1266 N 350 W Unit 159
- 212 Rose Anne Cir
- 2265 N 225 E Unit 48
- 1278 N 375 W Unit 152
- 269 E 2300 N
- 270 E 2275 N Unit 33
- 123 Hillsborough Dr Unit 71
- 110 Arlington Way
- 108 Arlington Way
- 108 Arlington Way Unit 166
- 104 Arlington Way
- 104 Arlington Way Unit 165
- 114 Arlington Way
- 102 Arlington Way
- 102 Arlington Way Unit 164
- 118 Arlington Way
- 118 Arlington Way Unit 169
- 120 Arlington Way
- 120 Arlington Way Unit 170
- 2464 Charleston Ave
- 2470 Charleston Ave
- 2462 Charleston Ave
- 2474 Charleston Ave
- 2474 Charleston Ave Unit 108
- 2476 Charleston Ave
- 2476 Charleston Ave Unit 109
- 2458 Wellington Ave Unit 163