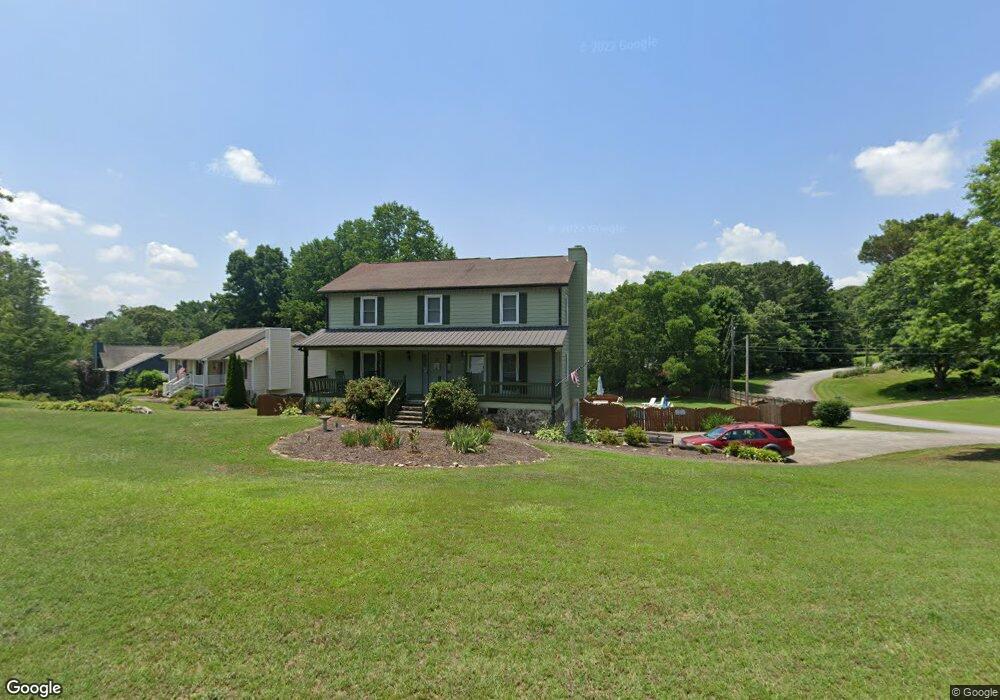
110 Aspen Ct Unit 1 Woodstock, GA 30188
Union Hill NeighborhoodEstimated Value: $394,000 - $425,153
3
Beds
3
Baths
1,968
Sq Ft
$206/Sq Ft
Est. Value
About This Home
This home is located at 110 Aspen Ct Unit 1, Woodstock, GA 30188 and is currently estimated at $405,788, approximately $206 per square foot. 110 Aspen Ct Unit 1 is a home located in Cherokee County with nearby schools including Johnston Elementary School, Mill Creek Middle School, and River Ridge High School.
Ownership History
Date
Name
Owned For
Owner Type
Purchase Details
Closed on
Jul 27, 2000
Sold by
Wade Jason S and Wade Shuk-Yan J
Bought by
Chenweth Charles R and Chenweth Loma A
Current Estimated Value
Home Financials for this Owner
Home Financials are based on the most recent Mortgage that was taken out on this home.
Original Mortgage
$105,600
Outstanding Balance
$49,364
Interest Rate
12.45%
Estimated Equity
$356,424
Purchase Details
Closed on
May 31, 1996
Sold by
Sec Hud
Bought by
Wade Jason and Young Shuk Yan Johanna
Purchase Details
Closed on
Feb 6, 1996
Sold by
Suntrust Mtg Inc
Bought by
Sec Hud
Purchase Details
Closed on
Aug 3, 1993
Sold by
Gallo Carmine J and Gallo Nancy
Bought by
Conley William H and Conley Victoria
Home Financials for this Owner
Home Financials are based on the most recent Mortgage that was taken out on this home.
Original Mortgage
$102,087
Interest Rate
10%
Create a Home Valuation Report for This Property
The Home Valuation Report is an in-depth analysis detailing your home's value as well as a comparison with similar homes in the area
Home Values in the Area
Average Home Value in this Area
Purchase History
| Date | Buyer | Sale Price | Title Company |
|---|---|---|---|
| Chenweth Charles R | $132,000 | -- | |
| Wade Jason | -- | -- | |
| Sec Hud | $111,300 | -- | |
| Suntrust Mtg Inc | $111,300 | -- | |
| Conley William H | $10,000 | -- |
Source: Public Records
Mortgage History
| Date | Status | Borrower | Loan Amount |
|---|---|---|---|
| Open | Chenweth Charles R | $105,600 | |
| Previous Owner | Conley William H | $102,087 | |
| Closed | Wade Jason | $0 |
Source: Public Records
Tax History Compared to Growth
Tax History
| Year | Tax Paid | Tax Assessment Tax Assessment Total Assessment is a certain percentage of the fair market value that is determined by local assessors to be the total taxable value of land and additions on the property. | Land | Improvement |
|---|---|---|---|---|
| 2024 | $705 | $144,980 | $30,400 | $114,580 |
| 2023 | $564 | $144,200 | $26,800 | $117,400 |
| 2022 | $662 | $120,144 | $25,200 | $94,944 |
| 2021 | $659 | $103,848 | $20,000 | $83,848 |
| 2020 | $590 | $84,672 | $17,000 | $67,672 |
| 2019 | $575 | $80,760 | $16,400 | $64,360 |
| 2018 | $568 | $76,280 | $14,800 | $61,480 |
| 2017 | $567 | $181,000 | $12,800 | $59,600 |
| 2016 | $566 | $169,400 | $11,600 | $56,160 |
| 2015 | $555 | $151,500 | $11,600 | $49,000 |
| 2014 | $1,684 | $142,900 | $11,600 | $45,560 |
Source: Public Records
Map
Nearby Homes
- 215 Valley Brook Dr
- 214 Valley Brook Dr
- 234 Holly Creek Way
- 151 Springwater Trace
- 145 Springwater Trace
- 415 Sweetgum Dr Unit 7
- 160 Highlands Dr
- 1855 Doefield St
- 713 Parkside Dr
- 614 Springharbor Dr
- 161 Stoney Creek Pkwy
- 589 Fox Creek Crossing
- 512 S Holly Springs Rd
- 524 S Holly Springs Rd
- 505 Lost Creek Dr
- 126 Highlands Dr Unit 1
- 5945 Holly Springs Pkwy
- 404 Hickory Walk
- 406 Hickory Walk
- 112 Aspen Ct
- 111 Aspen Ct
- 113 Aspen Ct Unit 1
- 108 Aspen Ct
- 405 Hickory Walk
- 115 Aspen Ct
- 408 Hickory Walk Unit 1
- 407 Hickory Walk
- 0 Aspen Ct Unit 7532213
- 0 Aspen Ct Unit 7414385
- 0 Aspen Ct Unit 3161644
- 0 Aspen Ct Unit 8834026
- 0 Aspen Ct
- 114 Aspen Ct Unit 2
- 117 Aspen Ct
- 109 Aspen Ct
- 305 White Oak Cove Unit 1
- 409 Hickory Walk Unit 1