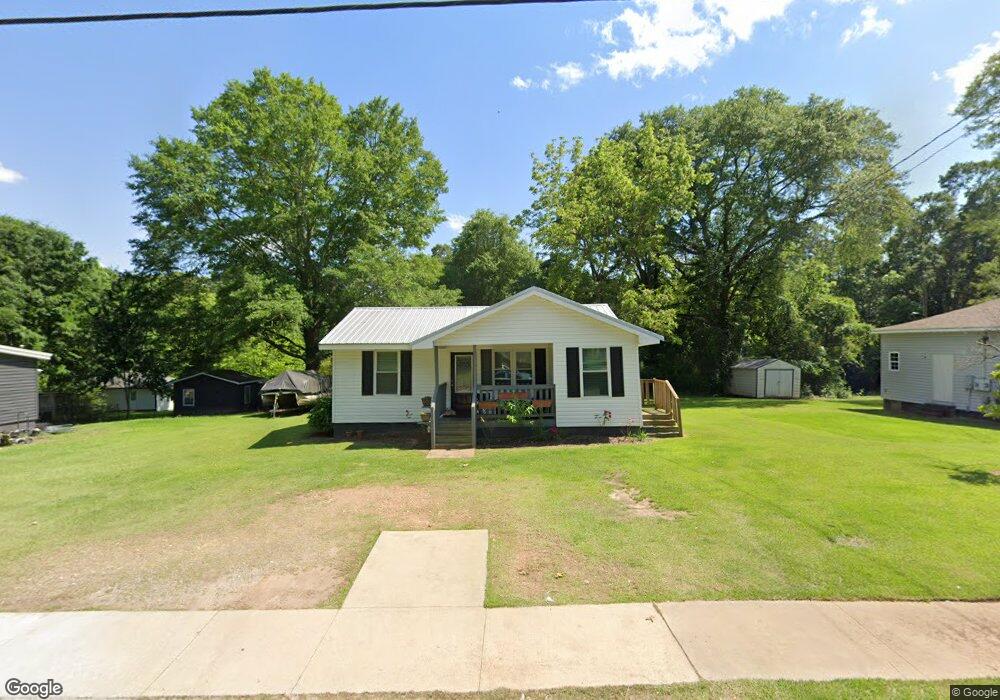
110 Avenue C Carrollton, GA 30117
Estimated Value: $127,000 - $206,000
3
Beds
1
Bath
816
Sq Ft
$192/Sq Ft
Est. Value
About This Home
This home is located at 110 Avenue C, Carrollton, GA 30117 and is currently estimated at $156,960, approximately $192 per square foot. 110 Avenue C is a home located in Carroll County with nearby schools including Carrollton Elementary School, Carrollton Upper Elementary School, and Carrollton Middle School.
Ownership History
Date
Name
Owned For
Owner Type
Purchase Details
Closed on
Sep 30, 2020
Sold by
Purpleglass Llc
Bought by
Barralaga Johel and Montalvan Marleny Flores
Current Estimated Value
Home Financials for this Owner
Home Financials are based on the most recent Mortgage that was taken out on this home.
Original Mortgage
$120,000
Outstanding Balance
$2,051
Interest Rate
2.9%
Mortgage Type
New Conventional
Estimated Equity
$154,909
Purchase Details
Closed on
Jun 14, 2013
Sold by
Piper Properties Llc
Bought by
Purpleglass Llc
Purchase Details
Closed on
Dec 31, 2002
Sold by
Richards Joel
Bought by
Piper Properties Llc
Purchase Details
Closed on
Jun 1, 2000
Sold by
Rowell
Bought by
Richards Joel
Purchase Details
Closed on
Jun 1, 1987
Bought by
Rowell
Create a Home Valuation Report for This Property
The Home Valuation Report is an in-depth analysis detailing your home's value as well as a comparison with similar homes in the area
Home Values in the Area
Average Home Value in this Area
Purchase History
| Date | Buyer | Sale Price | Title Company |
|---|---|---|---|
| Barralaga Johel | $120,000 | -- | |
| Purpleglass Llc | $49,713 | -- | |
| Piper Properties Llc | -- | -- | |
| Richards Joel | $35,000 | -- | |
| Rowell | $10,000 | -- |
Source: Public Records
Mortgage History
| Date | Status | Borrower | Loan Amount |
|---|---|---|---|
| Open | Barralaga Johel | $120,000 |
Source: Public Records
Tax History Compared to Growth
Tax History
| Year | Tax Paid | Tax Assessment Tax Assessment Total Assessment is a certain percentage of the fair market value that is determined by local assessors to be the total taxable value of land and additions on the property. | Land | Improvement |
|---|---|---|---|---|
| 2025 | $771 | $29,120 | $5,817 | $23,303 |
| 2024 | $796 | $29,120 | $5,817 | $23,303 |
| 2023 | $796 | $27,141 | $5,818 | $21,323 |
| 2022 | $612 | $20,970 | $3,888 | $17,082 |
| 2021 | $517 | $17,712 | $2,880 | $14,832 |
| 2020 | $472 | $16,168 | $2,880 | $13,288 |
| 2019 | $449 | $15,213 | $2,880 | $12,333 |
| 2018 | $422 | $14,112 | $2,880 | $11,232 |
| 2017 | $425 | $14,112 | $2,880 | $11,232 |
| 2016 | $427 | $14,112 | $2,880 | $11,232 |
| 2015 | $415 | $13,444 | $2,880 | $10,564 |
| 2014 | $417 | $13,444 | $2,880 | $10,564 |
Source: Public Records
Map
Nearby Homes
- 114 Second St
- 109 7th St
- 109 Seventh St
- 219 Broad St
- 106 Summerfield Place Dr
- 223 Riversong Rd Unit 55
- 223 Riversong Rd
- 149 River Dr
- 149 River Dr Unit 42
- 250 Riversong Rd
- 250 Riversong Rd Unit 55
- 160 Watson St
- 166 Maple St
- 654 King St
- 141 Bowen St
- 142 Griffin Dr
- 105 Haygood Place
- 1915 Whooping Creek Church Road - Tract #1
- 1915 Whooping Creek Church Road - Tract #2
- 330 Avalon Dr