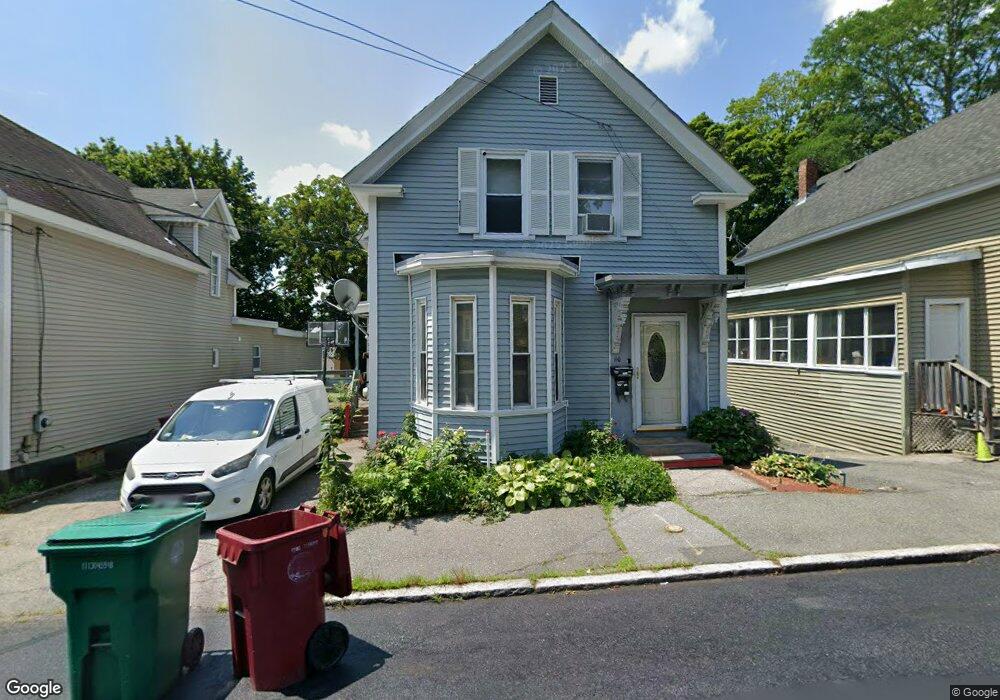
110 Beech St Unit 2 Lowell, MA 01850
Centralville NeighborhoodEstimated Value: $469,000 - $569,000
2
Beds
1
Bath
1,100
Sq Ft
$474/Sq Ft
Est. Value
About This Home
This home is located at 110 Beech St Unit 2, Lowell, MA 01850 and is currently estimated at $521,920, approximately $474 per square foot. 110 Beech St Unit 2 is a home located in Middlesex County with nearby schools including S. Christa McAuliffe Elementary School, Greenhalge Elementary School, and Moody Elementary School.
Ownership History
Date
Name
Owned For
Owner Type
Purchase Details
Closed on
Mar 1, 2021
Sold by
Cheam Kouy
Bought by
Mannan Manoj and Mannan Ashima
Current Estimated Value
Home Financials for this Owner
Home Financials are based on the most recent Mortgage that was taken out on this home.
Original Mortgage
$312,000
Outstanding Balance
$279,686
Interest Rate
2.7%
Mortgage Type
Purchase Money Mortgage
Estimated Equity
$242,234
Purchase Details
Closed on
Jan 11, 2018
Sold by
Uon Samang
Bought by
Cheam Kouy
Home Financials for this Owner
Home Financials are based on the most recent Mortgage that was taken out on this home.
Original Mortgage
$148,148
Interest Rate
5.12%
Mortgage Type
FHA
Purchase Details
Closed on
Oct 21, 2008
Sold by
Le Dung and Uon Samang
Bought by
Uon Samnang
Purchase Details
Closed on
Aug 30, 1996
Sold by
Kloza Mark A
Bought by
Le Dung and Uon Samang
Home Financials for this Owner
Home Financials are based on the most recent Mortgage that was taken out on this home.
Original Mortgage
$84,600
Interest Rate
8.18%
Mortgage Type
Purchase Money Mortgage
Create a Home Valuation Report for This Property
The Home Valuation Report is an in-depth analysis detailing your home's value as well as a comparison with similar homes in the area
Home Values in the Area
Average Home Value in this Area
Purchase History
| Date | Buyer | Sale Price | Title Company |
|---|---|---|---|
| Mannan Manoj | $416,000 | None Available | |
| Cheam Kouy | $182,000 | -- | |
| Uon Samnang | -- | -- | |
| Uon Samnang | -- | -- | |
| Le Dung | $94,000 | -- | |
| Le Dung | $94,000 | -- |
Source: Public Records
Mortgage History
| Date | Status | Borrower | Loan Amount |
|---|---|---|---|
| Open | Mannan Manoj | $312,000 | |
| Previous Owner | Cheam Kouy | $148,148 | |
| Previous Owner | Le Dung | $84,600 |
Source: Public Records
Tax History
| Year | Tax Paid | Tax Assessment Tax Assessment Total Assessment is a certain percentage of the fair market value that is determined by local assessors to be the total taxable value of land and additions on the property. | Land | Improvement |
|---|---|---|---|---|
| 2025 | $5,396 | $470,000 | $128,600 | $341,400 |
| 2024 | $5,027 | $422,100 | $120,200 | $301,900 |
| 2023 | $4,669 | $375,900 | $104,500 | $271,400 |
| 2022 | $4,322 | $340,600 | $95,000 | $245,600 |
| 2021 | $4,008 | $297,800 | $82,600 | $215,200 |
| 2020 | $3,615 | $270,600 | $72,200 | $198,400 |
| 2019 | $3,478 | $247,700 | $66,800 | $180,900 |
| 2018 | $3,013 | $221,900 | $63,700 | $158,200 |
| 2017 | $3,020 | $202,400 | $57,900 | $144,500 |
| 2016 | $3,047 | $201,000 | $56,500 | $144,500 |
| 2015 | $2,827 | $182,600 | $56,500 | $126,100 |
| 2013 | $2,601 | $173,300 | $66,000 | $107,300 |
Source: Public Records
Map
Nearby Homes
- 27-29 Fifth St
- 106 Methuen St Unit B
- 105 3rd St
- 25 Read St
- 94 1st St Unit 10
- 18 May St
- 192 1st St
- Lot 11 Christian St
- Lot 12 Christian St
- Lot 9 Christian St
- Lot 10 Christian St
- 45 W 4th St
- 3 Vernon St
- Lots 1-12 Christian Hill Dev
- 81 Reservoir St
- 82 Christian St
- 120 Lakeview Ave
- 202 Coburn St
- 52 Christian St
- 42 Christian St
- 110 Beech St
- 106 Beech St
- 112 Beech St
- 114 Beech St
- 102 Beech St
- 111 Myrtle St
- 107 Myrtle St
- 107 Myrtle St Unit 2
- 107 Myrtle St Unit 1
- 119 Myrtle St
- 101 Myrtle St
- 94 Beech St
- 109 Beech St
- 107-107 Beech St Unit 101
- 107-107 Beech St Unit 103R
- 115 Beech St
- 119 Beech St
- 90 Beech St
- 125 Myrtle St
- 95 Myrtle St
Your Personal Tour Guide
Ask me questions while you tour the home.