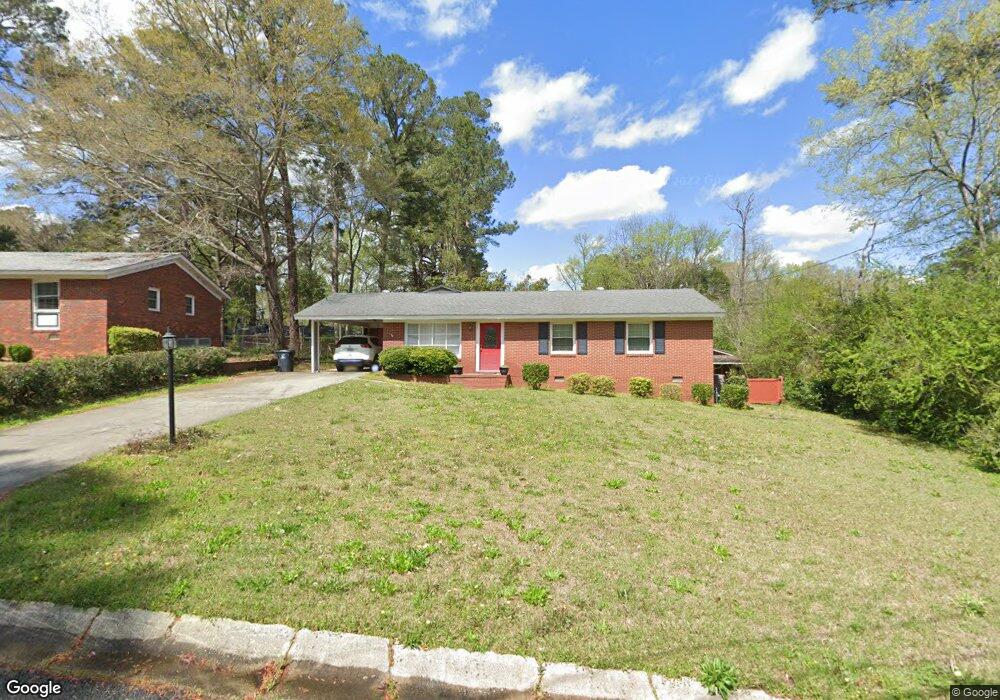
110 Beechwood Cir SW Milledgeville, GA 31061
Estimated Value: $200,995 - $250,000
3
Beds
2
Baths
1,785
Sq Ft
$125/Sq Ft
Est. Value
About This Home
This home is located at 110 Beechwood Cir SW, Milledgeville, GA 31061 and is currently estimated at $222,749, approximately $124 per square foot. 110 Beechwood Cir SW is a home located in Baldwin County with nearby schools including Midway Hills Primary School, Midway Hills Academy, and Oak Hill Middle School.
Ownership History
Date
Name
Owned For
Owner Type
Purchase Details
Closed on
Apr 27, 2015
Sold by
Giddens Tara S
Bought by
Cooper Juanita
Current Estimated Value
Home Financials for this Owner
Home Financials are based on the most recent Mortgage that was taken out on this home.
Original Mortgage
$105,056
Outstanding Balance
$79,649
Interest Rate
3.25%
Mortgage Type
FHA
Estimated Equity
$143,100
Purchase Details
Closed on
Sep 9, 2008
Sold by
Mcgowan Katie G
Bought by
Giddens Tara S and Giddens Matthew N
Home Financials for this Owner
Home Financials are based on the most recent Mortgage that was taken out on this home.
Original Mortgage
$79,800
Interest Rate
6.49%
Mortgage Type
New Conventional
Purchase Details
Closed on
Nov 18, 2004
Sold by
Brooks Patricia G and Brooks Marcus L
Bought by
Mcgowan Katie G and Mcgowan Ronald
Create a Home Valuation Report for This Property
The Home Valuation Report is an in-depth analysis detailing your home's value as well as a comparison with similar homes in the area
Home Values in the Area
Average Home Value in this Area
Purchase History
| Date | Buyer | Sale Price | Title Company |
|---|---|---|---|
| Cooper Juanita | $107,000 | -- | |
| Giddens Tara S | $114,000 | -- | |
| Mcgowan Katie G | $106,000 | -- |
Source: Public Records
Mortgage History
| Date | Status | Borrower | Loan Amount |
|---|---|---|---|
| Open | Cooper Juanita | $105,056 | |
| Previous Owner | Giddens Tara S | $79,800 |
Source: Public Records
Tax History Compared to Growth
Tax History
| Year | Tax Paid | Tax Assessment Tax Assessment Total Assessment is a certain percentage of the fair market value that is determined by local assessors to be the total taxable value of land and additions on the property. | Land | Improvement |
|---|---|---|---|---|
| 2025 | $1,772 | $72,708 | $2,700 | $70,008 |
| 2024 | $1,772 | $72,708 | $2,700 | $70,008 |
| 2023 | $39 | $54,700 | $2,252 | $52,448 |
| 2022 | $218 | $55,872 | $2,252 | $53,620 |
| 2021 | $229 | $39,140 | $2,252 | $36,888 |
| 2020 | $216 | $38,960 | $2,240 | $36,720 |
| 2019 | $217 | $38,960 | $2,240 | $36,720 |
| 2018 | $224 | $38,960 | $2,240 | $36,720 |
| 2017 | $192 | $38,960 | $2,240 | $36,720 |
| 2016 | $192 | $29,444 | $3,360 | $26,084 |
| 2015 | $525 | $29,444 | $3,360 | $26,084 |
| 2014 | $526 | $29,444 | $3,360 | $26,084 |
Source: Public Records
Map
Nearby Homes
- 118 Allenwood Rd SW
- 129 Bay Valley Dr SW
- 321 Glenhaven Dr
- 1101 W Hancock St
- 174 Helen Cir SW
- 161 N Glynn St
- 123 Helen Cir SW
- 921 W Thomas St
- 751 W Montgomery St
- 131 Irby St SW
- 331 N Irwin St
- 121 Elder Dr SW
- 641 N Cobb St
- 500 N Tattnall St
- 210 C N Main St SW
- 341 S Clarke St
- 152 Allen Memorial Dr SW
- 2756 N North Columiba
- 111 Lockwood St SW
- 152 Allen Memorial Dr
- 110 Beech Wood Cir SW Unit 7
- 110 Beechwood Cir Unit 7
- 110 Beech Wood Cir SW
- 110 Beechwood Cir
- 117 Allenwood Cir SW
- 117 Allenwood Rd SW
- 108 Beech Wood Cir SW
- 113 Allenwood Rd SW
- 111 Hickory Dr SW
- 109 Hickory Dr SW
- W Beechwood Cir SW
- 123 Allenwood Rd SW
- 123 Allenwood Cir SW
- 102 Beech Wood Cir SW
- 102 Beech Wood Cir SW
- 111 Allenwood Cir SW
- 111 Allenwood Rd SW
- 107 SW Beechwood Cir
- 100 Beech Wood Cir SW
- 118 Allenwood Cir SW