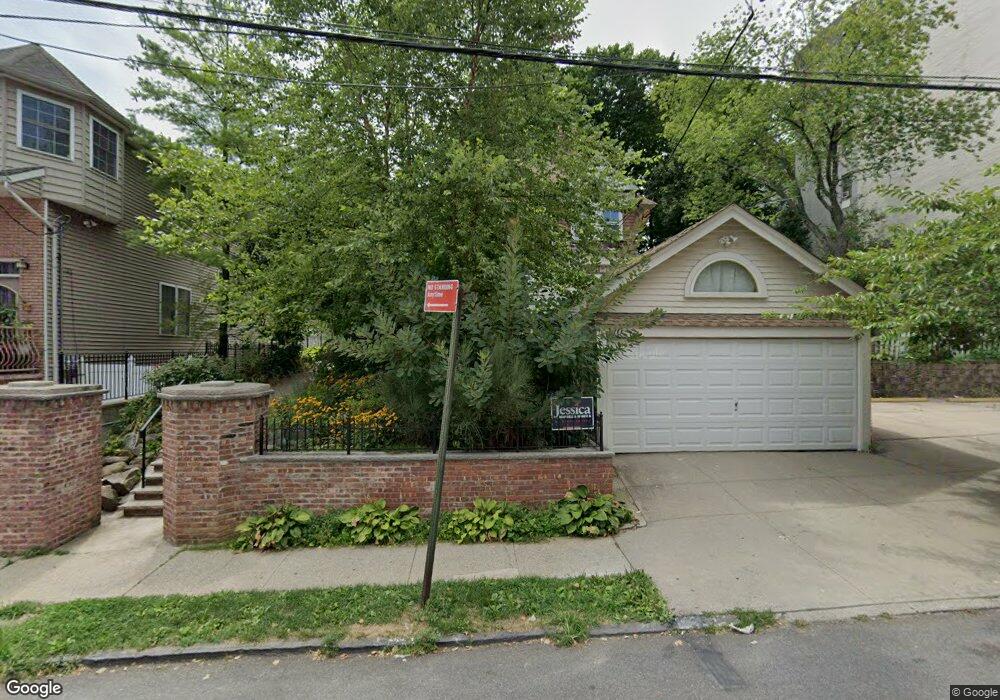
110 Belmont Place Staten Island, NY 10301
Saint George NeighborhoodEstimated Value: $696,944 - $967,000
About This Home
3 large rooms plus new eat-in kitchen with dishwasher, wide foyer, new bathroom with large cast-iron tub, PLUS beautifully re-finished attic studio perfect for work-from-home space
Completely detached house on quiet block and set back onto park-like property with great light and space. Quick, free harbor cruise to Downtown Manhattan, and fast ferry to Midtown.
Upstairs apartment (so only considerate people need apply), private side entrance
Hardwood floors, French doors, chestnut trim, high ceilings
Two (non-working) fireplaces, exposed brick in dining area, living room and bedroom
Recently renovated, split system AC, new electric and plumbing systems and high-end finishes
Fully finished attic with skylight, storage, and oak floors
Huge yard, with goldfish pond, extensive private garden
7-minute walk to free SI Ferry (runs 24/7, dream commute to downtown Manhattan, then all subways to midtown) AND fast ferry to Battery Park City and Midtown.
Easy street parking (no meters or alternate side), or off-street parking available
Deli and laundromat on corner, supermarket three blocks away
One block to Farmer's Market Saturdays year-round
Close to all of Downtown SI's amenities, including waterfront promenade, museums, Empire Outlets, microbreweries, and many restaurants
No fee, one month security, references, a copy of your own credit report may clinch. No smoking (inside or out), no dogs (we like them, but hardwood floors do not), one indoor-only cat permitted
Home Values in the Area
Average Home Value in this Area
Property History
| Date | Event | Price | List to Sale | Price per Sq Ft |
|---|---|---|---|---|
| 09/01/2024 09/01/24 | For Rent | $2,475 | -- | -- |
Tax History Compared to Growth
Tax History
| Year | Tax Paid | Tax Assessment Tax Assessment Total Assessment is a certain percentage of the fair market value that is determined by local assessors to be the total taxable value of land and additions on the property. | Land | Improvement |
|---|---|---|---|---|
| 2025 | $5,267 | $46,560 | $8,374 | $38,186 |
| 2024 | $5,267 | $49,680 | $7,411 | $42,269 |
| 2023 | $5,326 | $26,225 | $7,475 | $18,750 |
| 2022 | $4,916 | $40,080 | $14,040 | $26,040 |
| 2021 | $5,157 | $34,740 | $14,040 | $20,700 |
| 2020 | $4,898 | $38,400 | $14,040 | $24,360 |
| 2019 | $4,572 | $33,360 | $14,040 | $19,320 |
| 2018 | $4,157 | $21,854 | $8,439 | $13,415 |
| 2017 | $4,112 | $21,644 | $11,156 | $10,488 |
| 2016 | $3,772 | $20,420 | $10,525 | $9,895 |
| 2015 | $3,190 | $19,284 | $7,659 | $11,625 |
| 2014 | $3,190 | $18,212 | $6,816 | $11,396 |
Map
- 50 Fort Place Unit A3J
- 50 Fort Place Unit B4B
- 50 Fort Place Unit A6B
- 50 Fort Place Unit B3AB
- 50 Fort Place Unit B3C
- 50 Fort Place Unit B4C
- 165 Daniel Low Terrace
- 301 Westervelt Ave
- 36 Hamilton Ave Unit 6H
- 36 Hamilton Ave Unit 2E
- 36 Hamilton Ave Unit 6T
- 36 Hamilton Ave Unit 4S
- 36 Hamilton Ave Unit 6J
- 36 Hamilton Ave Unit 3J
- 36 Hamilton Ave Unit 5A
- 36 Hamilton Ave Unit 4B
- 36 Hamilton Ave Unit 3A
- 36 Hamilton Ave Unit 6S
- 0 Bay St Unit 2503634
- 102 Montgomery Ave
- 112 Belmont Place
- 114 Belmont Place
- 37 Fort Place
- 39 Fort Place
- 41 Fort Place
- 43 Fort Place
- 35 Fort Place
- 100 Daniel Low Terrace
- 45 Fort Place
- 27 Fort Place
- 115 Belmont Place
- 117 Daniel Low Terrace
- 88 Belmont Place
- 17 Fort Place
- 86 Belmont Place
- 19 Fort Place
- 88 Wall St
- 15 Fort Place
- 82 Belmont Place
- 1 Monroe Ave Unit 2