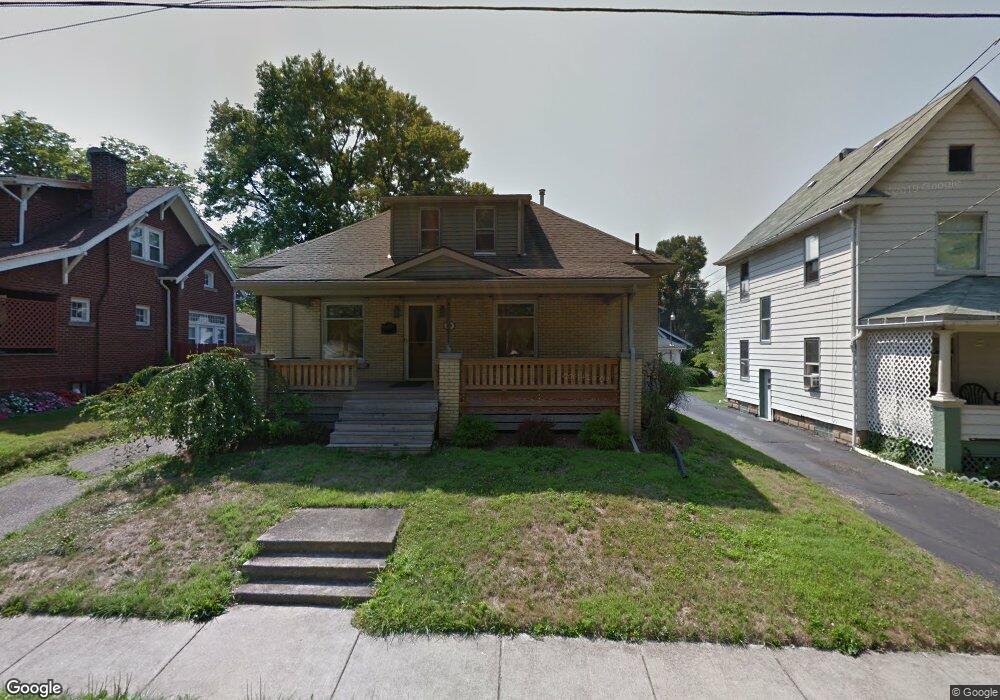
110 Bentley St Hubbard, OH 44425
Estimated Value: $97,000 - $145,000
3
Beds
1
Bath
1,008
Sq Ft
$117/Sq Ft
Est. Value
About This Home
This home is located at 110 Bentley St, Hubbard, OH 44425 and is currently estimated at $118,000, approximately $117 per square foot. 110 Bentley St is a home located in Trumbull County with nearby schools including Hubbard Elementary School, Hubbard Middle School, and Hubbard High School.
Ownership History
Date
Name
Owned For
Owner Type
Purchase Details
Closed on
Jul 30, 2015
Sold by
Smith Janet R
Bought by
Dorney Benjamin L
Current Estimated Value
Home Financials for this Owner
Home Financials are based on the most recent Mortgage that was taken out on this home.
Original Mortgage
$40,000
Outstanding Balance
$31,438
Interest Rate
4.01%
Mortgage Type
New Conventional
Estimated Equity
$86,562
Purchase Details
Closed on
Aug 31, 2010
Sold by
Core Craig B
Bought by
Smith Janet R
Purchase Details
Closed on
Apr 9, 1999
Sold by
Schotten Glenn F
Bought by
Candella Chris J and Candella Melissa
Home Financials for this Owner
Home Financials are based on the most recent Mortgage that was taken out on this home.
Original Mortgage
$41,656
Interest Rate
6.94%
Purchase Details
Closed on
Jan 1, 1990
Bought by
Glenn Schotten
Create a Home Valuation Report for This Property
The Home Valuation Report is an in-depth analysis detailing your home's value as well as a comparison with similar homes in the area
Home Values in the Area
Average Home Value in this Area
Purchase History
| Date | Buyer | Sale Price | Title Company |
|---|---|---|---|
| Dorney Benjamin L | $175,000 | Attorney | |
| Smith Janet R | -- | None Available | |
| Candella Chris J | $42,000 | -- | |
| Glenn Schotten | -- | -- |
Source: Public Records
Mortgage History
| Date | Status | Borrower | Loan Amount |
|---|---|---|---|
| Open | Dorney Benjamin L | $40,000 | |
| Previous Owner | Candella Chris J | $41,656 |
Source: Public Records
Tax History Compared to Growth
Tax History
| Year | Tax Paid | Tax Assessment Tax Assessment Total Assessment is a certain percentage of the fair market value that is determined by local assessors to be the total taxable value of land and additions on the property. | Land | Improvement |
|---|---|---|---|---|
| 2024 | $1,585 | $31,710 | $3,570 | $28,140 |
| 2023 | $1,585 | $31,710 | $3,570 | $28,140 |
| 2022 | $1,155 | $21,040 | $3,220 | $17,820 |
| 2021 | $1,160 | $21,040 | $3,220 | $17,820 |
| 2020 | $1,166 | $21,040 | $3,220 | $17,820 |
| 2019 | $1,097 | $18,970 | $3,220 | $15,750 |
| 2018 | $1,093 | $18,970 | $3,220 | $15,750 |
| 2017 | $1,091 | $18,970 | $3,220 | $15,750 |
| 2016 | $952 | $17,570 | $3,220 | $14,350 |
| 2015 | $948 | $17,430 | $3,080 | $14,350 |
| 2014 | $927 | $17,430 | $3,080 | $14,350 |
| 2013 | $925 | $17,430 | $3,080 | $14,350 |
Source: Public Records
Map
Nearby Homes
- 203 Hager St
- 160 Hager St
- 323 W Liberty St
- 110 School St
- 124 Rebecca Ave
- 312 W Park Ave
- 652 Meadowland Dr
- 239 Elmwood Dr
- 138 Moore St
- 351 Elmwood Dr
- 191 Maple Leaf Dr
- 381 Lauretta Ln
- 366 Westview Ave
- 28 Spring St
- 6982 Mcclure Rd
- 6287 Youngstown Hubbard Rd
- 132 Drummond Ave
- 1034 Doris Dr
- 3397 Pothour Wheeler Rd
- 3234 Bell Wick Rd