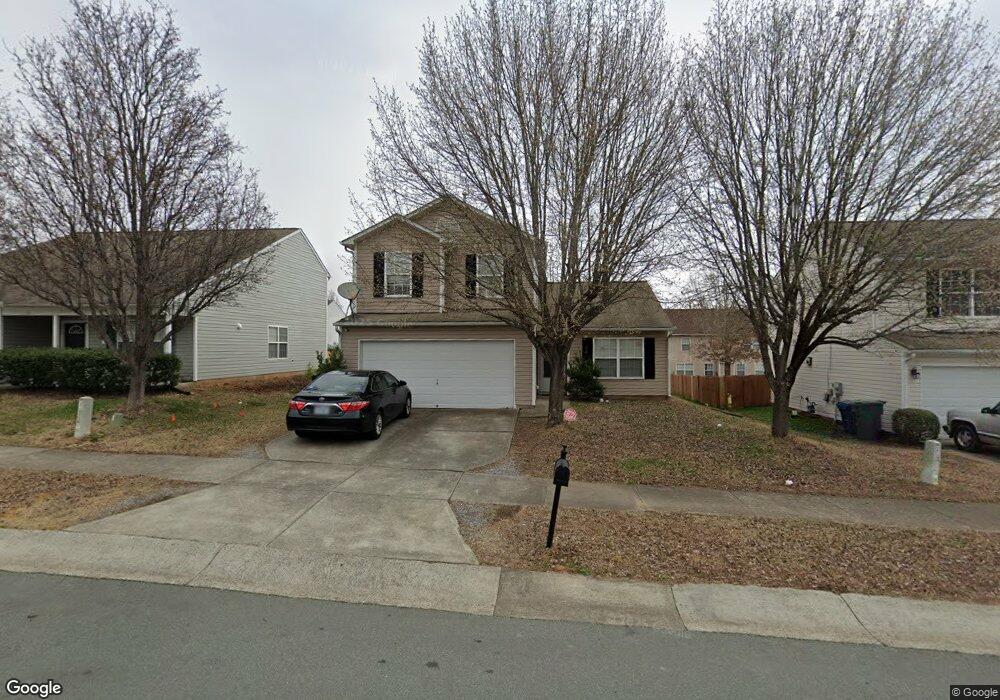
110 Big Leaf Way Durham, NC 27704
Weaver NeighborhoodEstimated Value: $313,282 - $328,000
3
Beds
3
Baths
1,540
Sq Ft
$208/Sq Ft
Est. Value
About This Home
This home is located at 110 Big Leaf Way, Durham, NC 27704 and is currently estimated at $320,321, approximately $208 per square foot. 110 Big Leaf Way is a home located in Durham County with nearby schools including Sandy Ridge Elementary School, Lucas Middle School, and Northern High School.
Ownership History
Date
Name
Owned For
Owner Type
Purchase Details
Closed on
Jun 14, 2013
Sold by
Self-Help Community Development Corp
Bought by
Oladiran Semiu A and Oladiran Muibat
Current Estimated Value
Home Financials for this Owner
Home Financials are based on the most recent Mortgage that was taken out on this home.
Original Mortgage
$102,900
Outstanding Balance
$72,805
Interest Rate
3.37%
Mortgage Type
New Conventional
Estimated Equity
$247,516
Purchase Details
Closed on
Oct 23, 2012
Sold by
Hsbc Mortgage Services Inc
Bought by
Cdc Self-Help
Purchase Details
Closed on
Jul 7, 2005
Sold by
Beazer Homes Corp
Bought by
Brady Kia S
Home Financials for this Owner
Home Financials are based on the most recent Mortgage that was taken out on this home.
Original Mortgage
$110,900
Interest Rate
6.5%
Mortgage Type
Fannie Mae Freddie Mac
Create a Home Valuation Report for This Property
The Home Valuation Report is an in-depth analysis detailing your home's value as well as a comparison with similar homes in the area
Home Values in the Area
Average Home Value in this Area
Purchase History
| Date | Buyer | Sale Price | Title Company |
|---|---|---|---|
| Oladiran Semiu A | $103,000 | None Available | |
| Cdc Self-Help | $87,000 | None Available | |
| Brady Kia S | $139,000 | -- |
Source: Public Records
Mortgage History
| Date | Status | Borrower | Loan Amount |
|---|---|---|---|
| Open | Oladiran Semiu A | $102,900 | |
| Previous Owner | Brady Kia S | $110,900 | |
| Previous Owner | Brady Kia S | $27,700 |
Source: Public Records
Tax History
| Year | Tax Paid | Tax Assessment Tax Assessment Total Assessment is a certain percentage of the fair market value that is determined by local assessors to be the total taxable value of land and additions on the property. | Land | Improvement |
|---|---|---|---|---|
| 2025 | $2,944 | $297,003 | $71,250 | $225,753 |
| 2024 | $2,209 | $158,369 | $28,600 | $129,769 |
| 2023 | $2,074 | $158,369 | $28,600 | $129,769 |
| 2022 | $2,027 | $158,369 | $28,600 | $129,769 |
| 2021 | $2,017 | $158,369 | $28,600 | $129,769 |
| 2020 | $1,970 | $158,369 | $28,600 | $129,769 |
| 2019 | $1,970 | $158,369 | $28,600 | $129,769 |
| 2018 | $1,919 | $141,439 | $28,600 | $112,839 |
| 2017 | $1,904 | $141,439 | $28,600 | $112,839 |
| 2016 | $1,840 | $141,439 | $28,600 | $112,839 |
| 2015 | $1,892 | $136,707 | $32,466 | $104,241 |
| 2014 | $1,892 | $136,707 | $32,466 | $104,241 |
Source: Public Records
Map
Nearby Homes
- 508 Weeping Willow Dr
- 601 Weeping Willow Dr
- 2200 Titanium Rock Rd
- 2208 Titanium Rock Rd
- 2206 Titanium Rock Rd
- 2204 Titanium Rock Rd
- 2131 Titanium Rock Rd
- 5014 Rainmaker Dr
- 2129 Titanium Rock Rd
- 2123 Titanium Rock Rd
- 2125 Titanium Rock Rd
- 512 Summer Storm Dr
- 705 Felicia St
- 4520 Denfield St
- 809 Felicia St
- 3 Windchime Ct
- 5422 Whippoorwill St
- 5309 Old Well St
- 4511 Denfield St
- 711 Wheat Mill Rd
- 108 Big Leaf Way
- 112 Big Leaf Way
- 105 Geranium St
- 114 Big Leaf Way
- 107 Geranium St
- 103 Geranium St
- 106 Big Leaf Way
- 109 Geranium St
- 111 Big Leaf Way
- 109 Big Leaf Way
- 116 Big Leaf Way
- 113 Big Leaf Way
- 107 Big Leaf Way
- 111 Geranium St
- 5305 Danube Ln
- 115 Big Leaf Way
- 5307 Danube Ln
- 105 Big Leaf Way
- 118 Big Leaf Way
- 102 Big Leaf Way
Your Personal Tour Guide
Ask me questions while you tour the home.