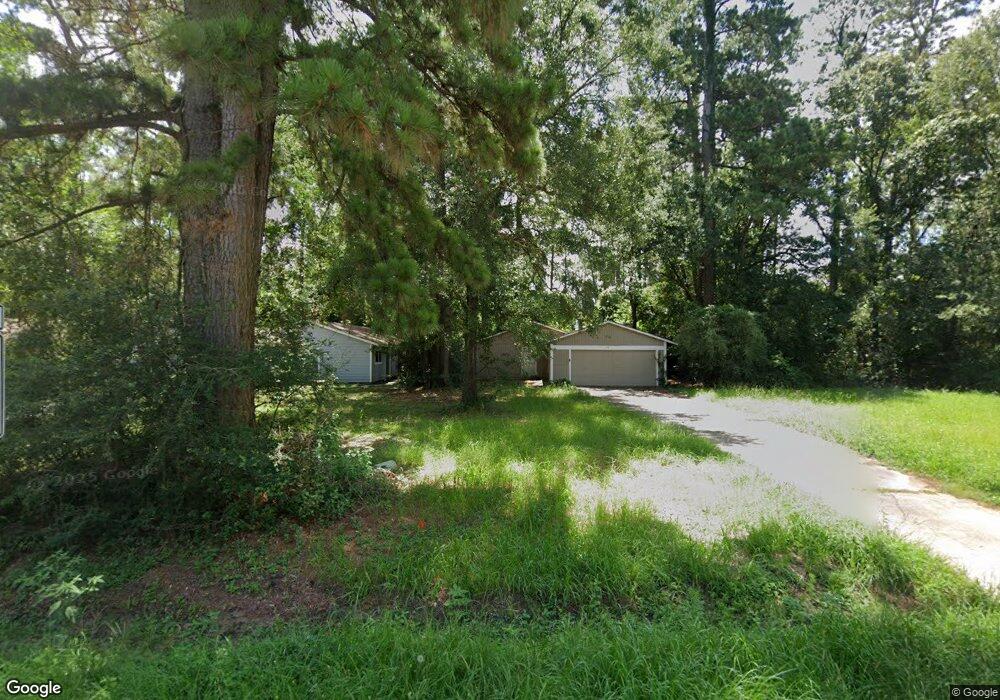
110 Blue Fox Rd Spring, TX 77380
Grogan's Mill NeighborhoodEstimated Value: $208,000 - $266,000
--
Bed
2
Baths
1,152
Sq Ft
$211/Sq Ft
Est. Value
About This Home
This home is located at 110 Blue Fox Rd, Spring, TX 77380 and is currently estimated at $242,896, approximately $210 per square foot. 110 Blue Fox Rd is a home located in Montgomery County with nearby schools including Lamar Elementary School, W.D Wilkerson Intermediate School, and Knox J High School.
Ownership History
Date
Name
Owned For
Owner Type
Purchase Details
Closed on
Mar 20, 2020
Sold by
Nored Jimmy D and Dds Jimmy Don
Bought by
Guel Jaime
Current Estimated Value
Home Financials for this Owner
Home Financials are based on the most recent Mortgage that was taken out on this home.
Original Mortgage
$165,000
Interest Rate
3.4%
Mortgage Type
Seller Take Back
Purchase Details
Closed on
Nov 29, 2018
Sold by
Aleman Fernando
Bought by
Nored Dds Jimmy Don
Purchase Details
Closed on
Dec 5, 2017
Sold by
Aleman Fernando and The Silver Trust Foundation
Bought by
C J Properties
Purchase Details
Closed on
Oct 15, 2012
Sold by
Nored Dds Jimmy Don and Strawn Bonita Florine
Bought by
Silver Trust Foundation and Aleman Fernando
Purchase Details
Closed on
Feb 9, 1996
Sold by
Hale Frieda S
Bought by
Nored Jimmy Don
Create a Home Valuation Report for This Property
The Home Valuation Report is an in-depth analysis detailing your home's value as well as a comparison with similar homes in the area
Home Values in the Area
Average Home Value in this Area
Purchase History
| Date | Buyer | Sale Price | Title Company |
|---|---|---|---|
| Guel Jaime | -- | First American Title | |
| Nored Dds Jimmy Don | -- | None Available | |
| C J Properties | $100,500 | None Available | |
| Silver Trust Foundation | -- | None Available | |
| Nored Jimmy Don | -- | -- |
Source: Public Records
Mortgage History
| Date | Status | Borrower | Loan Amount |
|---|---|---|---|
| Closed | Guel Jaime | $165,000 |
Source: Public Records
Tax History Compared to Growth
Tax History
| Year | Tax Paid | Tax Assessment Tax Assessment Total Assessment is a certain percentage of the fair market value that is determined by local assessors to be the total taxable value of land and additions on the property. | Land | Improvement |
|---|---|---|---|---|
| 2025 | $3,470 | $191,687 | $40,000 | $151,687 |
| 2024 | $3,470 | $200,920 | $40,000 | $160,920 |
| 2023 | $3,255 | $187,910 | $40,000 | $147,910 |
| 2022 | $3,410 | $178,600 | $40,000 | $138,600 |
| 2021 | $2,823 | $137,910 | $14,590 | $123,320 |
| 2020 | $2,827 | $131,600 | $14,590 | $117,010 |
| 2019 | $2,725 | $123,210 | $14,590 | $108,620 |
| 2018 | $2,862 | $129,420 | $14,590 | $114,830 |
| 2017 | $2,907 | $129,420 | $14,590 | $114,830 |
| 2016 | $2,907 | $129,420 | $14,590 | $114,830 |
| 2015 | $2,180 | $122,200 | $14,590 | $107,610 |
| 2014 | $2,180 | $96,340 | $14,590 | $81,750 |
Source: Public Records
Map
Nearby Homes
- 722 Shadowbrook Dr
- 723 Shadowbrook Dr
- 25419 Elm Creek Dr
- 25427 Elm Creek Dr
- 90 Crystal Lake Ln
- 17 Night Hawk Place
- 33 Crystal Lake Ln
- 25607 Pecan Valley Cir
- 25606 Pecan Valley Cir
- 713 Sawdust Rd
- 86 Cokeberry St
- 402 Pine Edge Dr
- 98 S Dreamweaver Cir
- 25706 Overlake Dr
- 28 Sawmill Grove Ln
- 67 Marabou Place
- 51 Marabou Place
- 1904 Nursery Rd
- 56 N Morningwood Ct
- 13 Honey Daffodil Place
- 108 Blue Fox Rd
- 106 Blue Fox Rd
- 109 Blue Fox Rd
- 0 Blue Fox Rd
- 0 Blue Fox Rd Unit 98794784
- 0 Blue Fox Rd Unit 33641575
- 2 Blue Fox Ct
- 4 Blue Fox Ct
- 105 Blue Fox Rd
- 906 Appomattox Dr
- 910 Appomattox Dr
- 8 Blue Fox Ct
- 902 Appomattox Dr
- 914 Appomattox Dr
- 834 Appomattox Dr
- 101 Blue Fox Rd
- 830 Appomattox Dr
- 1 Blue Fox Ct
- 3 Blue Fox Ct
- 10 Blue Fox Ct