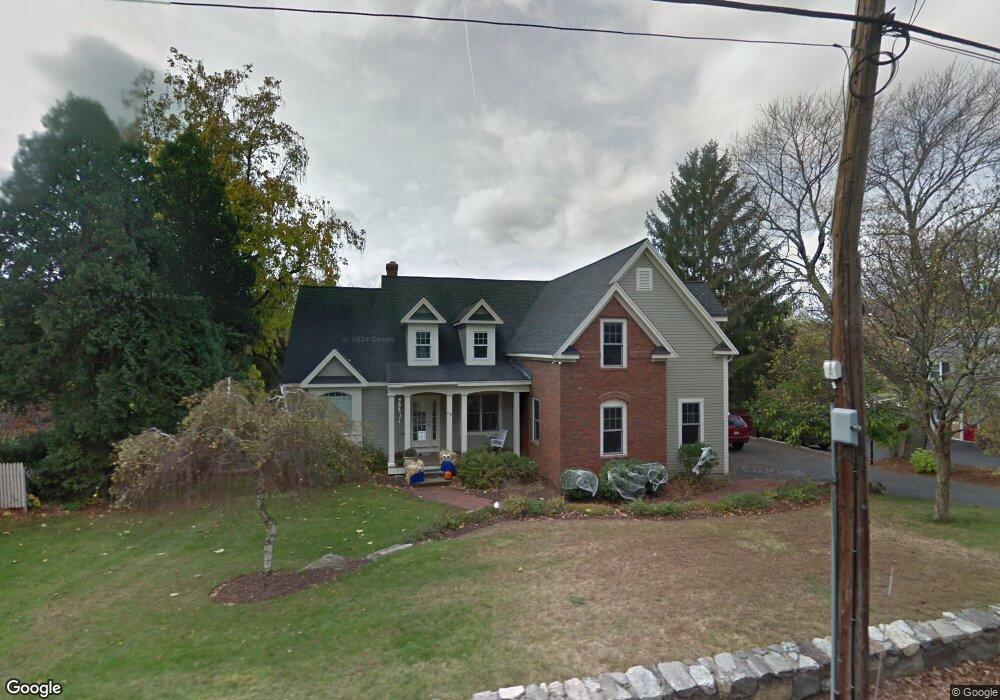
110 Brigham St Northborough, MA 01532
Estimated Value: $978,611 - $1,156,000
4
Beds
3
Baths
2,900
Sq Ft
$363/Sq Ft
Est. Value
About This Home
This home is located at 110 Brigham St, Northborough, MA 01532 and is currently estimated at $1,052,153, approximately $362 per square foot. 110 Brigham St is a home located in Worcester County with nearby schools including Marguerite E. Peaslee Elementary School, Robert E. Melican Middle School, and Algonquin Regional High School.
Ownership History
Date
Name
Owned For
Owner Type
Purchase Details
Closed on
Jun 29, 2017
Sold by
Kerwin Brian J and Kerwin Stephanie A
Bought by
Fortini Dana M and Fortini Russell F
Current Estimated Value
Home Financials for this Owner
Home Financials are based on the most recent Mortgage that was taken out on this home.
Original Mortgage
$472,000
Outstanding Balance
$393,546
Interest Rate
4.02%
Mortgage Type
Unknown
Estimated Equity
$658,607
Purchase Details
Closed on
Sep 21, 2007
Sold by
Goodwin Carolyn M
Bought by
Kerwin Brian J and Kerwin Stephanie A
Purchase Details
Closed on
Nov 24, 2004
Sold by
Tobin Jennifer and Tobin Steven J
Bought by
Goodwin Carolyn and Wilper John
Purchase Details
Closed on
Nov 18, 2002
Sold by
Banks Ft and Banks Arthur L
Bought by
Tobin Steven J and Tobin Jennifer
Create a Home Valuation Report for This Property
The Home Valuation Report is an in-depth analysis detailing your home's value as well as a comparison with similar homes in the area
Home Values in the Area
Average Home Value in this Area
Purchase History
| Date | Buyer | Sale Price | Title Company |
|---|---|---|---|
| Fortini Dana M | $590,000 | -- | |
| Kerwin Brian J | $570,000 | -- | |
| Goodwin Carolyn | $579,900 | -- | |
| Tobin Steven J | $94,000 | -- | |
| Kerwin Brian J | $570,000 | -- | |
| Goodwin Carolyn | $579,900 | -- | |
| Tobin Steven J | $94,000 | -- |
Source: Public Records
Mortgage History
| Date | Status | Borrower | Loan Amount |
|---|---|---|---|
| Open | Fortini Dana M | $472,000 | |
| Closed | Tobin Steven J | $472,000 | |
| Previous Owner | Tobin Steven J | $25,000 | |
| Previous Owner | Tobin Steven J | $410,000 |
Source: Public Records
Tax History Compared to Growth
Tax History
| Year | Tax Paid | Tax Assessment Tax Assessment Total Assessment is a certain percentage of the fair market value that is determined by local assessors to be the total taxable value of land and additions on the property. | Land | Improvement |
|---|---|---|---|---|
| 2025 | $13,803 | $968,600 | $252,300 | $716,300 |
| 2024 | $12,809 | $897,000 | $204,200 | $692,800 |
| 2023 | $12,776 | $863,800 | $192,600 | $671,200 |
| 2022 | $12,005 | $728,000 | $183,400 | $544,600 |
| 2021 | $11,660 | $681,100 | $166,600 | $514,500 |
| 2020 | $12,087 | $700,700 | $166,600 | $534,100 |
| 2019 | $11,635 | $678,400 | $166,600 | $511,800 |
| 2018 | $11,189 | $643,400 | $157,800 | $485,600 |
| 2017 | $11,006 | $632,900 | $157,800 | $475,100 |
| 2016 | $10,402 | $605,800 | $154,400 | $451,400 |
| 2015 | $9,299 | $555,800 | $162,700 | $393,100 |
| 2014 | $8,748 | $527,300 | $162,700 | $364,600 |
Source: Public Records
Map
Nearby Homes
- 59 School St Unit B-8
- 26 Maple St
- 5 Swan View Common Dr
- 85 Hudson St Unit 87
- 85 Hudson St Unit 85
- 6 Silas Dr
- 4 Country Candle Ln Unit 4
- 6 Vanessa Dr
- 21 Juniper Brook Rd
- 223 South St
- 14 Vanessa Dr
- 198 South St
- 254 South St
- 24 Juniper Brook Rd
- 89 W Main St
- 27 Intervale Farm Ln
- 86 Whitney St
- 90 W Main St
- 19 Crestwood Dr Unit 19
- 13 Deacon St
- 114 Brigham St
- 107 Brigham St Unit 2
- 107 Brigham St Unit 1
- 107 Brigham St Unit 4
- 107 Brigham St Unit 3
- 107 Brigham St
- 118 Brigham St
- 102 Brigham St
- 115 Brigham St
- 101 Brigham St
- 122 Brigham St
- 106 Brigham St
- 95 Brigham St
- 98 Brigham St
- 128 Brigham St
- 127 Brigham St
- 131 Brigham St
- 92 Brigham St
- 91 Brigham St
- 111 Brigham St