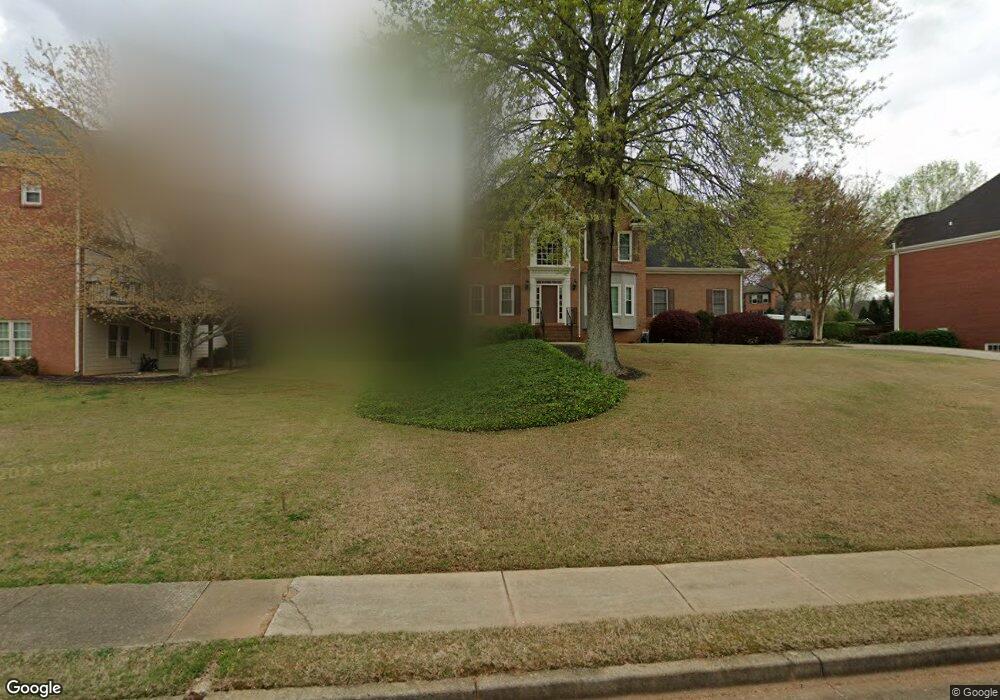
110 Brighton Cir Alpharetta, GA 30004
Estimated Value: $732,000 - $937,000
4
Beds
3
Baths
2,622
Sq Ft
$314/Sq Ft
Est. Value
About This Home
This home is located at 110 Brighton Cir, Alpharetta, GA 30004 and is currently estimated at $823,841, approximately $314 per square foot. 110 Brighton Cir is a home located in Fulton County with nearby schools including Crabapple Crossing Elementary School, Northwestern Middle School, and Milton High School.
Ownership History
Date
Name
Owned For
Owner Type
Purchase Details
Closed on
Nov 29, 2021
Sold by
Brown Rochelle M
Bought by
Brown Rochelle M and Brown Robert Hamilton
Current Estimated Value
Home Financials for this Owner
Home Financials are based on the most recent Mortgage that was taken out on this home.
Original Mortgage
$251,500
Outstanding Balance
$196,735
Interest Rate
2.37%
Mortgage Type
New Conventional
Estimated Equity
$627,106
Purchase Details
Closed on
Sep 8, 2009
Sold by
Grissom Michael J and Grissom Barbara L J
Bought by
Brown Rochelle M
Home Financials for this Owner
Home Financials are based on the most recent Mortgage that was taken out on this home.
Original Mortgage
$352,309
Interest Rate
5.15%
Mortgage Type
FHA
Purchase Details
Closed on
Apr 15, 1994
Sold by
Custom Design Bldrs Inc
Bought by
Grissom Michael J
Home Financials for this Owner
Home Financials are based on the most recent Mortgage that was taken out on this home.
Original Mortgage
$190,800
Interest Rate
6.12%
Create a Home Valuation Report for This Property
The Home Valuation Report is an in-depth analysis detailing your home's value as well as a comparison with similar homes in the area
Home Values in the Area
Average Home Value in this Area
Purchase History
| Date | Buyer | Sale Price | Title Company |
|---|---|---|---|
| Brown Rochelle M | -- | -- | |
| Brown Rochelle M | $360,000 | -- | |
| Grissom Michael J | $210,000 | -- |
Source: Public Records
Mortgage History
| Date | Status | Borrower | Loan Amount |
|---|---|---|---|
| Open | Brown Rochelle M | $251,500 | |
| Previous Owner | Brown Rochelle M | $352,309 | |
| Previous Owner | Grissom Michael J | $190,800 |
Source: Public Records
Tax History Compared to Growth
Tax History
| Year | Tax Paid | Tax Assessment Tax Assessment Total Assessment is a certain percentage of the fair market value that is determined by local assessors to be the total taxable value of land and additions on the property. | Land | Improvement |
|---|---|---|---|---|
| 2025 | $719 | $206,240 | $30,240 | $176,000 |
| 2023 | $5,927 | $210,000 | $30,240 | $179,760 |
| 2022 | $3,703 | $210,000 | $30,240 | $179,760 |
| 2021 | $4,302 | $156,000 | $24,120 | $131,880 |
| 2020 | $4,231 | $142,880 | $23,280 | $119,600 |
| 2019 | $635 | $164,960 | $32,080 | $132,880 |
| 2018 | $4,046 | $161,080 | $31,320 | $129,760 |
| 2017 | $3,568 | $134,240 | $23,360 | $110,880 |
| 2016 | $3,567 | $134,240 | $23,360 | $110,880 |
| 2015 | $4,153 | $134,240 | $23,360 | $110,880 |
| 2014 | $3,378 | $122,960 | $21,400 | $101,560 |
Source: Public Records
Map
Nearby Homes
- 12455 Pindell Cir
- 1360 Bethany Ct
- 1065 Mid Broadwell Rd
- 1050 Little River Ln
- 145 Pruitt Dr
- 7412 Mid Broadwell Trace
- 785 Briars Bend
- 7411 Mid Broadwell Trace
- 1395 Mid Broadwell Rd
- 175 Heatherton Ln
- 1500 Mid Broadwell Rd
- 12350 Charlotte Dr
- 245 Heatherton Way
- 275 Heatherton Way
- 1510 Shade Tree Way
- 1645 Mayfield Rd
- 2200 Cortland Rd
- 910 Reece Rd
- 1235 Chelsey Ln
- 120 Brighton Cir
- 105 Brighton Cir
- 115 Brighton Cir
- 0 Brighton Cir Unit 7210665
- 130 Brighton Cir
- 1255 Chelsey Ln
- 135 Brighton Cir
- 195 Brighton Cir
- 185 Brighton Cir
- 125 Brighton Cir
- 175 Brighton Cir
- 1230 Chelsey Ln
- 1240 Chelsey Ln
- 165 Brighton Cir
- 1220 Chelsey Ln
- 1250 Chelsey Ln
- 1205 Chelsey Ln
- 1265 Chelsey Ln
- 1210 Chelsey Ln