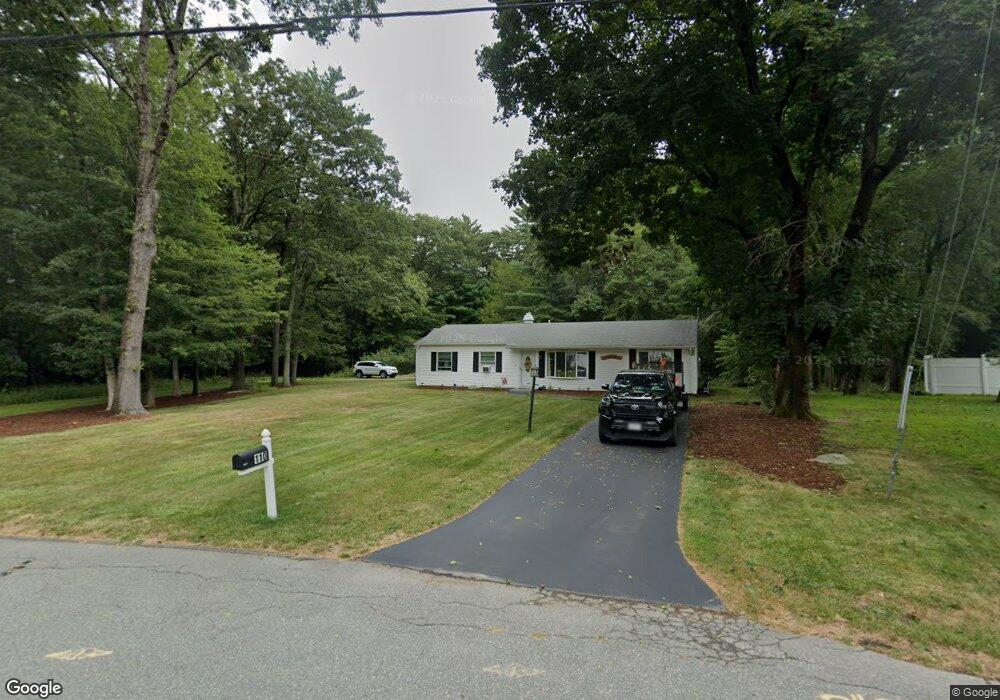
110 Brook Cir Hanover, MA 02339
Estimated Value: $573,000 - $632,000
3
Beds
2
Baths
1,325
Sq Ft
$455/Sq Ft
Est. Value
About This Home
This home is located at 110 Brook Cir, Hanover, MA 02339 and is currently estimated at $602,841, approximately $454 per square foot. 110 Brook Cir is a home located in Plymouth County with nearby schools including Hanover High School and Calvary Chapel Academy.
Ownership History
Date
Name
Owned For
Owner Type
Purchase Details
Closed on
Apr 20, 2004
Sold by
Sweeney Robert F
Bought by
Sweeney Diana R
Current Estimated Value
Purchase Details
Closed on
Apr 17, 2003
Sold by
Cook Stephen M
Bought by
Sweeney Diana Robin Coo and Sweeney Diana R
Purchase Details
Closed on
Oct 1, 1984
Bought by
Sweeney Diana
Create a Home Valuation Report for This Property
The Home Valuation Report is an in-depth analysis detailing your home's value as well as a comparison with similar homes in the area
Home Values in the Area
Average Home Value in this Area
Purchase History
| Date | Buyer | Sale Price | Title Company |
|---|---|---|---|
| Sweeney Diana R | -- | -- | |
| Sweeney Diana Robin Coo | -- | -- | |
| Sweeney Diana | -- | -- |
Source: Public Records
Mortgage History
| Date | Status | Borrower | Loan Amount |
|---|---|---|---|
| Open | Sweeney Diana | $75,000 | |
| Previous Owner | Sweeney Diana | $50,000 | |
| Previous Owner | Sweeney Diana | $104,000 |
Source: Public Records
Tax History Compared to Growth
Tax History
| Year | Tax Paid | Tax Assessment Tax Assessment Total Assessment is a certain percentage of the fair market value that is determined by local assessors to be the total taxable value of land and additions on the property. | Land | Improvement |
|---|---|---|---|---|
| 2025 | $5,874 | $475,600 | $219,200 | $256,400 |
| 2024 | $6,107 | $475,600 | $219,200 | $256,400 |
| 2023 | $5,623 | $416,800 | $199,300 | $217,500 |
| 2022 | $6,025 | $395,100 | $224,200 | $170,900 |
| 2021 | $61 | $359,300 | $192,800 | $166,500 |
| 2020 | $4,179 | $343,600 | $181,500 | $162,100 |
| 2019 | $46,856 | $303,300 | $158,800 | $144,500 |
| 2018 | $5,645 | $316,100 | $176,900 | $139,200 |
| 2017 | $5,302 | $299,600 | $171,900 | $127,700 |
| 2016 | $5,048 | $299,400 | $171,700 | $127,700 |
| 2015 | $4,604 | $285,100 | $171,700 | $113,400 |
Source: Public Records
Map
Nearby Homes