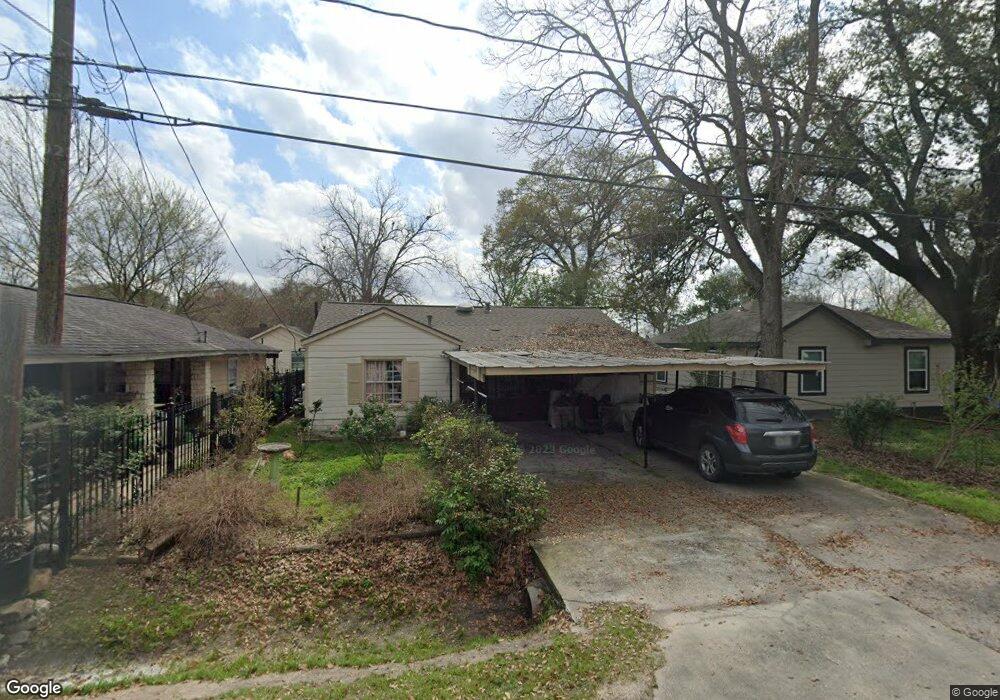
110 Burress St Houston, TX 77022
Northside-Northline NeighborhoodEstimated Value: $199,289 - $260,000
3
Beds
1
Bath
1,415
Sq Ft
$166/Sq Ft
Est. Value
About This Home
This home is located at 110 Burress St, Houston, TX 77022 and is currently estimated at $235,572, approximately $166 per square foot. 110 Burress St is a home located in Harris County with nearby schools including Burbank Elementary School, Burbank Middle School, and Sam Houston Math, Science & Technology Center.
Ownership History
Date
Name
Owned For
Owner Type
Purchase Details
Closed on
Oct 26, 2007
Sold by
Aguirre Artemio and Aguirre Norma
Bought by
Alanis Rodolfo L
Current Estimated Value
Home Financials for this Owner
Home Financials are based on the most recent Mortgage that was taken out on this home.
Original Mortgage
$108,000
Outstanding Balance
$68,121
Interest Rate
6.32%
Mortgage Type
Purchase Money Mortgage
Estimated Equity
$167,451
Create a Home Valuation Report for This Property
The Home Valuation Report is an in-depth analysis detailing your home's value as well as a comparison with similar homes in the area
Home Values in the Area
Average Home Value in this Area
Purchase History
| Date | Buyer | Sale Price | Title Company |
|---|---|---|---|
| Alanis Rodolfo L | -- | Ameripoint Title |
Source: Public Records
Mortgage History
| Date | Status | Borrower | Loan Amount |
|---|---|---|---|
| Open | Alanis Rodolfo L | $108,000 |
Source: Public Records
Tax History Compared to Growth
Tax History
| Year | Tax Paid | Tax Assessment Tax Assessment Total Assessment is a certain percentage of the fair market value that is determined by local assessors to be the total taxable value of land and additions on the property. | Land | Improvement |
|---|---|---|---|---|
| 2025 | $7 | $183,119 | $76,000 | $107,119 |
| 2024 | $7 | $189,987 | $69,750 | $120,237 |
| 2023 | $7 | $206,391 | $42,500 | $163,891 |
| 2022 | $3,109 | $170,274 | $42,500 | $127,774 |
| 2021 | $2,992 | $135,735 | $42,500 | $93,235 |
| 2020 | $2,826 | $124,162 | $42,500 | $81,662 |
| 2019 | $2,685 | $121,388 | $35,000 | $86,388 |
| 2018 | $242 | $96,452 | $29,250 | $67,202 |
| 2017 | $2,341 | $96,452 | $29,250 | $67,202 |
| 2016 | $2,128 | $96,452 | $27,500 | $68,952 |
| 2015 | $362 | $76,515 | $20,000 | $56,515 |
| 2014 | $362 | $76,515 | $20,000 | $56,515 |
Source: Public Records
Map
Nearby Homes
- 108 Fichter St
- 90 Burress St Unit B
- 90 Burress St Unit A
- 216 Burress St
- 249 De Boll St
- 253 De Boll St
- 70 Burress St
- 132 Grothe Ln
- 61 Trenwood Ln
- 318 Charlock St
- 44 Farrell St
- 56 Wellford St
- 202 Burbank St
- 45 Wellford St
- 9625 Fulton St
- 91 Burbank St
- 9026 Mcgallion Rd
- 110 Luetta St
- 108 Luetta St
- 106 Luetta St