Estimated Value: $58,145 - $100,000
1
Bed
1
Bath
360
Sq Ft
$195/Sq Ft
Est. Value
About This Home
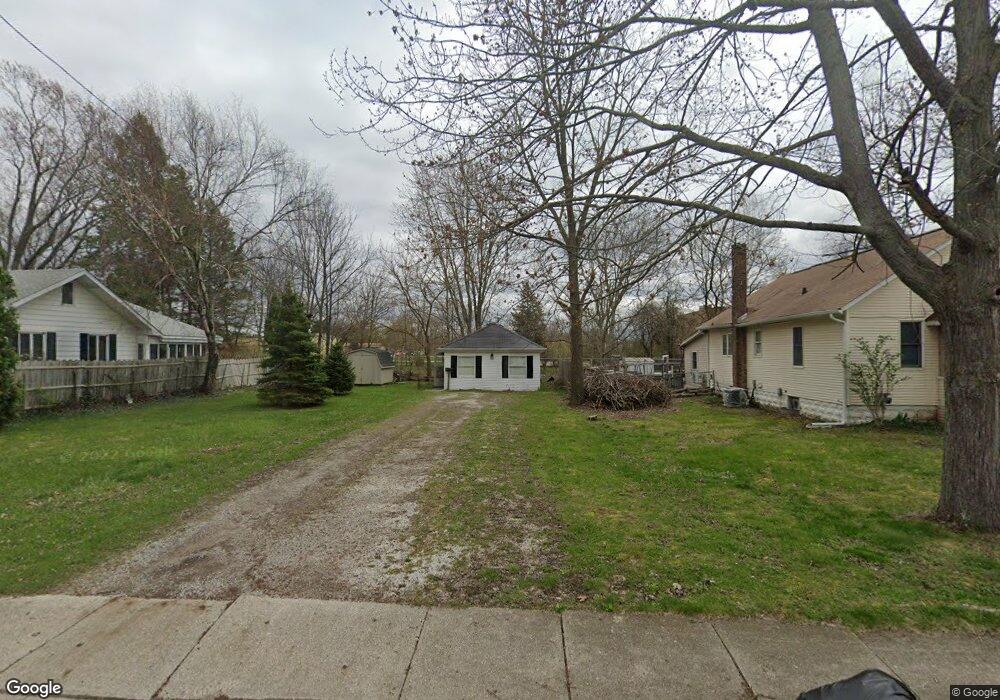
This home is located at 110 Butler St, Clio, MI 48420 and is currently estimated at $70,286, approximately $195 per square foot. 110 Butler St is a home located in Genesee County with nearby schools including George R. Carter Middle School and Clio Area High School.
Ownership History
Date
Name
Owned For
Owner Type
Purchase Details
Closed on
Apr 1, 2022
Sold by
Brown Russell
Bought by
Elliot Jason
Current Estimated Value
Purchase Details
Closed on
Jan 23, 2019
Sold by
Devere O & Gloria D Peterson Trust
Bought by
Brown Russell S
Purchase Details
Closed on
May 6, 2016
Sold by
Kranzo Mark N and Kranzo Sue A
Bought by
Peterson Devere O and Peterson Gloria D
Purchase Details
Closed on
Jan 20, 2015
Sold by
Kranzo Mark N and Kranzo Sue A
Bought by
Kranzo Mark N and Kranzo Sue A
Purchase Details
Closed on
Oct 19, 2012
Sold by
Kranzo Sue A
Bought by
Kranzo Mark N
Purchase Details
Closed on
Mar 11, 2004
Sold by
Kranzo Mark N and Kranzo Sue A
Bought by
Peterson Devere O and Peterson Gloria D
Home Financials for this Owner
Home Financials are based on the most recent Mortgage that was taken out on this home.
Original Mortgage
$40,000
Interest Rate
9%
Mortgage Type
Seller Take Back
Create a Home Valuation Report for This Property
The Home Valuation Report is an in-depth analysis detailing your home's value as well as a comparison with similar homes in the area
Home Values in the Area
Average Home Value in this Area
Purchase History
| Date | Buyer | Sale Price | Title Company |
|---|---|---|---|
| Elliot Jason | $50,000 | -- | |
| Brown Russell S | $25,200 | None Available | |
| Peterson Devere O | $45,000 | Attorney | |
| Kranzo Mark N | -- | None Available | |
| Kranzo Mark N | -- | None Available | |
| Peterson Devere O | $45,000 | -- | |
| Kranzo Mark N | -- | -- |
Source: Public Records
Mortgage History
| Date | Status | Borrower | Loan Amount |
|---|---|---|---|
| Previous Owner | Peterson Devere O | $40,000 |
Source: Public Records
Tax History
| Year | Tax Paid | Tax Assessment Tax Assessment Total Assessment is a certain percentage of the fair market value that is determined by local assessors to be the total taxable value of land and additions on the property. | Land | Improvement |
|---|---|---|---|---|
| 2025 | $1,508 | $17,600 | $0 | $0 |
| 2024 | $972 | $20,600 | $0 | $0 |
| 2023 | $927 | $19,700 | $0 | $0 |
| 2022 | $1,059 | $17,900 | $0 | $0 |
| 2021 | $1,030 | $14,300 | $0 | $0 |
| 2020 | $655 | $13,400 | $0 | $0 |
| 2019 | $533 | $12,900 | $0 | $0 |
| 2018 | $805 | $10,400 | $0 | $0 |
| 2017 | $786 | $10,400 | $0 | $0 |
| 2016 | $874 | $11,719 | $0 | $0 |
| 2015 | $878 | $11,500 | $0 | $0 |
| 2012 | -- | $12,500 | $12,500 | $0 |
Source: Public Records
Map
Nearby Homes
- 212 Darrow St
- 105 Washington St
- 140 E Johnson St
- 572 W Vienna St
- 421 W Johnson St
- 538 Park View
- 607 Park View
- vac land Vienna Rd
- M57 Vienna Rd
- 655 Park View
- 00000 N Saginaw Rd
- 0000 N Saginaw Rd
- 713 S Mill St
- 3337 Field Rd Unit A10
- 801 S Mill St
- 3338 Field Rd
- 13021 N Saginaw Rd
- 12160 Neff Rd
- 11461 Hidden Oaks Dr Unit 11
- 11457 Hidden Oaks Dr Unit 12
Your Personal Tour Guide
Ask me questions while you tour the home.