Estimated Value: $409,000 - $431,000
3
Beds
4
Baths
2,342
Sq Ft
$179/Sq Ft
Est. Value
About This Home
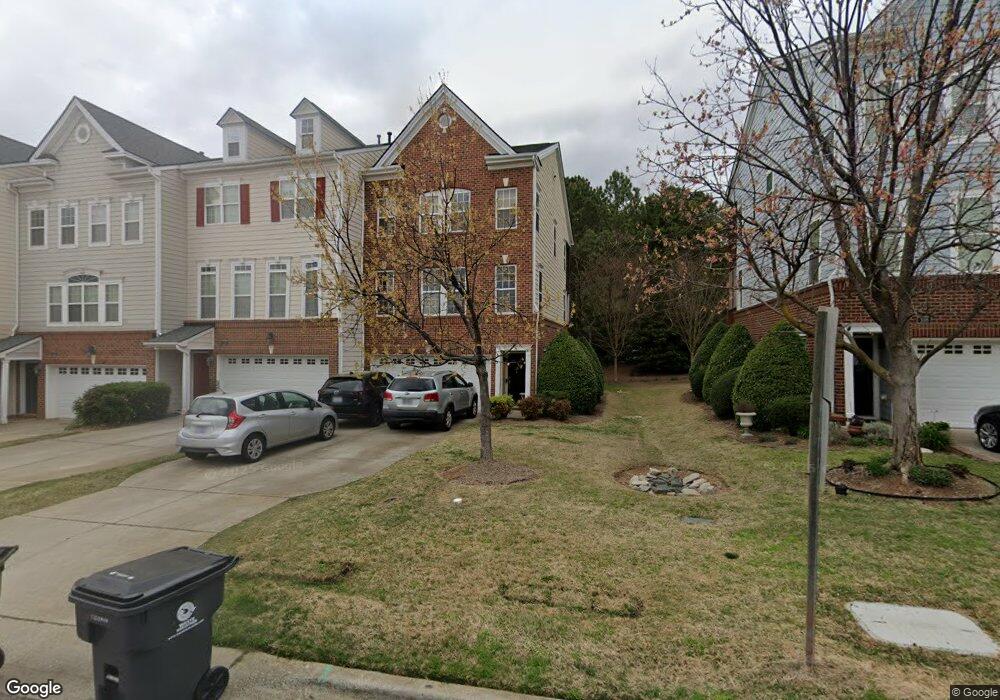
This home is located at 110 Butterbiggins Ln, Apex, NC 27539 and is currently estimated at $419,451, approximately $179 per square foot. 110 Butterbiggins Ln is a home located in Wake County with nearby schools including Middle Creek Elementary School, Dillard Drive Magnet Middle School, and Apex High School.
Ownership History
Date
Name
Owned For
Owner Type
Purchase Details
Closed on
Aug 6, 2020
Sold by
Kaufmann Julian E and Kaufmann Fiona Childs
Bought by
Riddick Karin
Current Estimated Value
Purchase Details
Closed on
Feb 15, 2018
Sold by
Kaufmann Julian E and Kaufmann Fiona Childs
Bought by
Kaufmann Julian E and Kaufmann Fiona Childs
Purchase Details
Closed on
May 6, 2016
Sold by
Fortuna David H and Fortuna Denise K
Bought by
Kaufmann Julian E
Home Financials for this Owner
Home Financials are based on the most recent Mortgage that was taken out on this home.
Original Mortgage
$202,500
Interest Rate
3.59%
Mortgage Type
New Conventional
Purchase Details
Closed on
Apr 1, 2006
Sold by
Lennar Carolinas Llc
Bought by
Fortuna David H and Fortuna Denise K
Home Financials for this Owner
Home Financials are based on the most recent Mortgage that was taken out on this home.
Original Mortgage
$177,550
Interest Rate
6.29%
Mortgage Type
Unknown
Create a Home Valuation Report for This Property
The Home Valuation Report is an in-depth analysis detailing your home's value as well as a comparison with similar homes in the area
Home Values in the Area
Average Home Value in this Area
Purchase History
| Date | Buyer | Sale Price | Title Company |
|---|---|---|---|
| Riddick Karin | $275,000 | None Available | |
| Kaufmann Julian E | -- | None Available | |
| Kaufmann Julian E | $225,000 | None Available | |
| Fortuna David H | $222,000 | None Available |
Source: Public Records
Mortgage History
| Date | Status | Borrower | Loan Amount |
|---|---|---|---|
| Previous Owner | Kaufmann Julian E | $202,500 | |
| Previous Owner | Fortuna David H | $177,550 |
Source: Public Records
Tax History
| Year | Tax Paid | Tax Assessment Tax Assessment Total Assessment is a certain percentage of the fair market value that is determined by local assessors to be the total taxable value of land and additions on the property. | Land | Improvement |
|---|---|---|---|---|
| 2025 | $3,522 | $406,872 | $90,000 | $316,872 |
| 2024 | $3,507 | $406,872 | $90,000 | $316,872 |
Source: Public Records
Map
Nearby Homes
- 103 Havelock Ct
- 104 Highland Mist Cir
- 109 Highland Mist Cir
- 4724 Sunset Lake Rd
- 4721 Edwards Dr
- 9640 Holly Springs Rd
- 4425 Surry Ridge Cir
- 206 Bowerbank Ln
- 114 Pleasant Glen Ln
- 4304 Triland Way
- 157 Writing Rock Place
- 102 Hemingford Grey Ct
- 155 Writing Rock Place
- 115 Bowerbank Ln
- 210 Castien Cove Place
- 115 Writing Rock Place
- 106 Castien Cove Place
- 5516 Colonial Oaks Dr
- 113 Mayfield Dr
- 209 Mayfield Dr
- 110 Butterbiggiins Ln
- 112 Butterbiggins Ln
- 108 Butterbiggins Ln
- 114 Butterbiggins Ln
- 106 Butterbiggins Ln
- 116 Butterbiggins Ln
- 104 Butterbiggins Ln
- 102 Butterbiggins Ln
- 200 Butterbiggins Ln
- 100 Butterbiggins Ln
- 109 Butterbiggins Ln
- 107 Butterbiggins Ln
- 105 Butterbiggins Ln
- 204 Butterbiggins Ln
- 103 Butterbiggins Ln
- 101 Butterbiggins Ln
- 201 Butterbiggins Ln
- 205 Butterbiggins Ln
- 208 Butterbiggins Ln
- 4509 Ness Dr
Your Personal Tour Guide
Ask me questions while you tour the home.