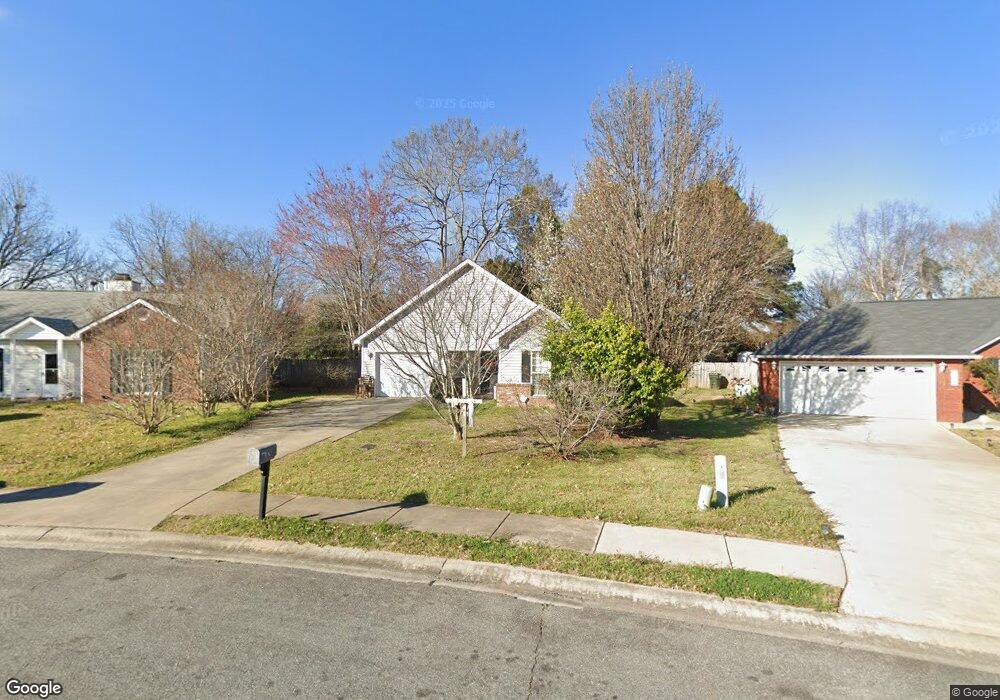
110 Camelot Place Warner Robins, GA 31093
Estimated Value: $156,000 - $197,260
3
Beds
2
Baths
1,347
Sq Ft
$137/Sq Ft
Est. Value
About This Home
This home is located at 110 Camelot Place, Warner Robins, GA 31093 and is currently estimated at $184,315, approximately $136 per square foot. 110 Camelot Place is a home located in Houston County with nearby schools including Parkwood Elementary School, Northside Middle School, and Northside High School.
Ownership History
Date
Name
Owned For
Owner Type
Purchase Details
Closed on
Oct 28, 2025
Sold by
Rlh Ventures Inc and Holman Robert
Bought by
Bcb Entities Llc
Current Estimated Value
Purchase Details
Closed on
May 17, 2016
Sold by
Ksgs Properties Llc
Bought by
Rlh Ventures Inc
Home Financials for this Owner
Home Financials are based on the most recent Mortgage that was taken out on this home.
Original Mortgage
$58,373
Interest Rate
3.59%
Mortgage Type
New Conventional
Purchase Details
Closed on
Jan 29, 2009
Sold by
Conner Erin Max
Bought by
Ksgs Properties Llc
Home Financials for this Owner
Home Financials are based on the most recent Mortgage that was taken out on this home.
Original Mortgage
$70,000
Interest Rate
5.24%
Mortgage Type
Construction
Purchase Details
Closed on
May 4, 2007
Sold by
Conner Charles H
Bought by
Conner Erin Max
Purchase Details
Closed on
Jul 30, 1999
Sold by
Asbell Max B
Bought by
Purves Evelyn F
Create a Home Valuation Report for This Property
The Home Valuation Report is an in-depth analysis detailing your home's value as well as a comparison with similar homes in the area
Home Values in the Area
Average Home Value in this Area
Purchase History
| Date | Buyer | Sale Price | Title Company |
|---|---|---|---|
| Bcb Entities Llc | -- | None Listed On Document | |
| Rlh Ventures Inc | -- | -- | |
| Ksgs Properties Llc | $10,000 | None Available | |
| Conner Erin Max | -- | -- | |
| Purves Evelyn F | $9,000 | -- |
Source: Public Records
Mortgage History
| Date | Status | Borrower | Loan Amount |
|---|---|---|---|
| Previous Owner | Rlh Ventures Inc | $58,373 | |
| Previous Owner | Ksgs Properties Llc | $70,000 |
Source: Public Records
Tax History Compared to Growth
Tax History
| Year | Tax Paid | Tax Assessment Tax Assessment Total Assessment is a certain percentage of the fair market value that is determined by local assessors to be the total taxable value of land and additions on the property. | Land | Improvement |
|---|---|---|---|---|
| 2024 | $1,945 | $59,440 | $8,000 | $51,440 |
| 2023 | $1,526 | $46,280 | $8,000 | $38,280 |
| 2022 | $905 | $39,360 | $4,800 | $34,560 |
| 2021 | $844 | $36,520 | $4,800 | $31,720 |
| 2020 | $734 | $31,600 | $4,800 | $26,800 |
| 2019 | $734 | $31,600 | $4,800 | $26,800 |
| 2018 | $734 | $31,600 | $4,800 | $26,800 |
| 2017 | $735 | $31,600 | $4,800 | $26,800 |
| 2016 | $736 | $31,600 | $4,800 | $26,800 |
| 2015 | -- | $31,600 | $4,800 | $26,800 |
| 2014 | $340 | $34,000 | $4,800 | $29,200 |
| 2013 | $340 | $34,000 | $4,800 | $29,200 |
Source: Public Records
Map
Nearby Homes
- 118 Avalon Dr
- 107 Galahad Dr
- 208 Pellimore Dr
- 112 Emory Dr
- 152 Rock Run Trail
- 131 Martin Mill Trail
- 857 Ola Dr
- 156 Red Birch Ln
- 317 Emory Dr
- 709 Meadowridge Dr
- 110 Foxfire Dr
- 123 Tanglewood Dr
- 719 Meadowridge Dr
- 302 Kensington Cir
- 305 Norman Ln
- 725 B East Side Dr
- 221 Gilchrist Dr
- 303 Pinecrest Dr
- 106 Tor Dr
- 112 Camelot Place
- 108 Camelot Place
- 114 Camelot Place
- 113 Avalon Dr
- 115 Avalon Dr
- 106 Camelot Place
- 105 Camelot Place
- 107 Camelot Place
- 116 Camelot Place
- 117 Avalon Dr
- 104 Camelot Place
- 109 Camelot Place
- 118 Camelot Place
- 102 Camelot Place
- 119 Avalon Dr
- 109 Avalon Dr
- 103 Camelot Place
- 107 Avalon Dr
- 111 Camelot Place
- 105 Avalon Dr