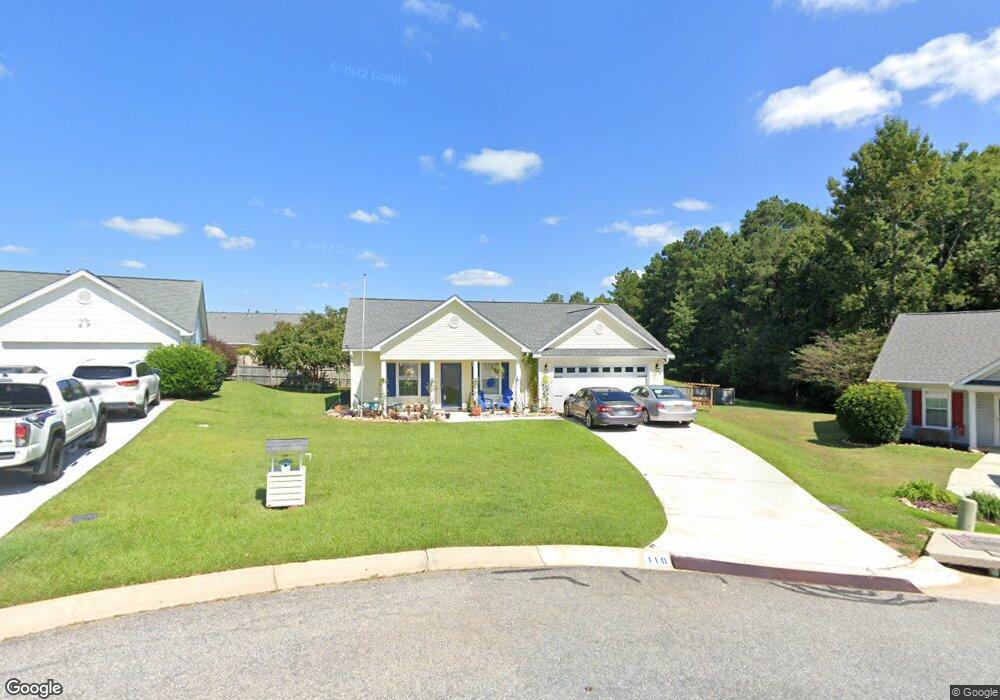
110 Candar Ct Chapin, SC 29036
Estimated Value: $210,256 - $226,000
3
Beds
2
Baths
1,320
Sq Ft
$163/Sq Ft
Est. Value
About This Home
This home is located at 110 Candar Ct, Chapin, SC 29036 and is currently estimated at $215,814, approximately $163 per square foot. 110 Candar Ct is a home located in Lexington County with nearby schools including Chapin Elementary School, Chapin Intermediate, and Chapin High School.
Ownership History
Date
Name
Owned For
Owner Type
Purchase Details
Closed on
May 1, 2006
Sold by
Marra Charles S and Marra Candace M
Bought by
Nation Tony D and Nation Lisa A
Current Estimated Value
Home Financials for this Owner
Home Financials are based on the most recent Mortgage that was taken out on this home.
Original Mortgage
$134,000
Outstanding Balance
$89,647
Interest Rate
9.29%
Mortgage Type
Adjustable Rate Mortgage/ARM
Estimated Equity
$126,167
Purchase Details
Closed on
Jul 11, 2001
Sold by
Fairhaven Llc
Bought by
Marra Charles S
Create a Home Valuation Report for This Property
The Home Valuation Report is an in-depth analysis detailing your home's value as well as a comparison with similar homes in the area
Home Values in the Area
Average Home Value in this Area
Purchase History
| Date | Buyer | Sale Price | Title Company |
|---|---|---|---|
| Nation Tony D | $134,000 | None Available | |
| Marra Charles S | $114,900 | -- |
Source: Public Records
Mortgage History
| Date | Status | Borrower | Loan Amount |
|---|---|---|---|
| Open | Nation Tony D | $134,000 |
Source: Public Records
Tax History
| Year | Tax Paid | Tax Assessment Tax Assessment Total Assessment is a certain percentage of the fair market value that is determined by local assessors to be the total taxable value of land and additions on the property. | Land | Improvement |
|---|---|---|---|---|
| 2024 | $934 | $5,077 | $1,200 | $3,877 |
| 2023 | $862 | $5,077 | $1,200 | $3,877 |
| 2022 | $851 | $5,077 | $1,200 | $3,877 |
| 2020 | $888 | $5,077 | $1,200 | $3,877 |
| 2019 | $888 | $5,009 | $1,192 | $3,817 |
| 2018 | $790 | $5,009 | $1,192 | $3,817 |
| 2017 | $764 | $5,009 | $1,192 | $3,817 |
| 2016 | $782 | $5,009 | $1,192 | $3,817 |
| 2014 | $812 | $5,217 | $962 | $4,255 |
| 2013 | -- | $5,220 | $960 | $4,260 |
Source: Public Records
Map
Nearby Homes
- 120 W Horn Ct
- 100 Recluse St
- 115 Merowey Ct
- 562 Griffon Dr
- 578 Griffon Dr
- 570 Griffon Dr
- 582 Griffon Dr
- 590 Griffon Dr
- 575 Griffon Dr
- 598 Griffon Dr
- 602 Griffon Dr
- 606 Griffon Dr
- 610 Griffon Dr
- 1679 Amicks Ferry Rd
- 409 Lever Hill Rd
- 0 E Boundary St
- 308 Turkey Beard Ct
- 118 Pacific Ave
- 0 Amicks Ferry Rd
- 120 Tail Feather Way
Your Personal Tour Guide
Ask me questions while you tour the home.