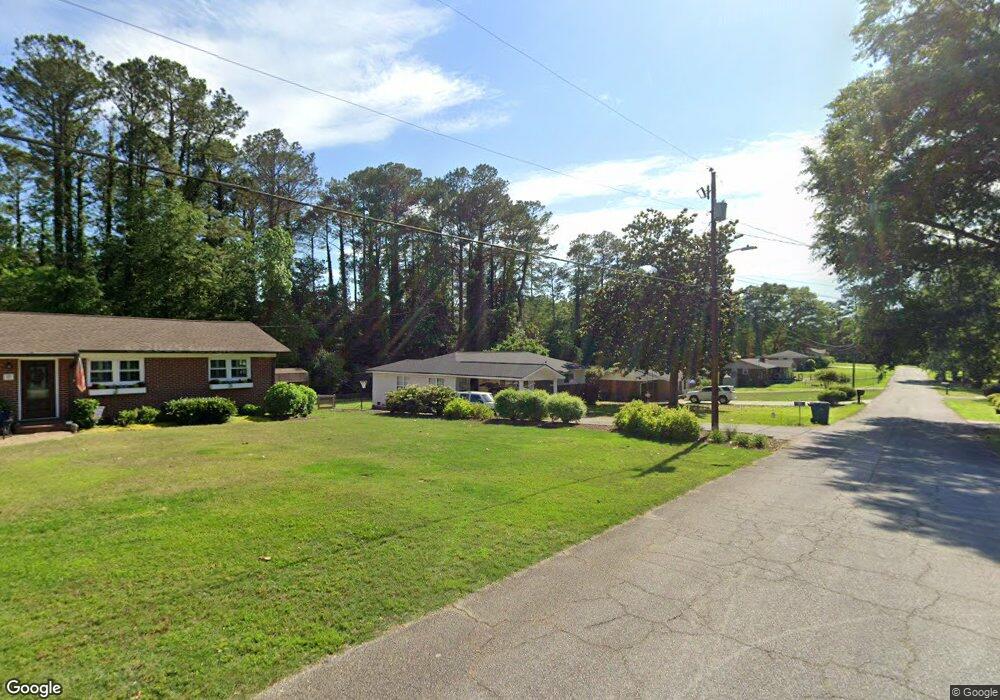
110 Carter Ave Carrollton, GA 30117
Estimated Value: $235,673 - $298,000
3
Beds
3
Baths
1,400
Sq Ft
$182/Sq Ft
Est. Value
About This Home
This home is located at 110 Carter Ave, Carrollton, GA 30117 and is currently estimated at $254,668, approximately $181 per square foot. 110 Carter Ave is a home located in Carroll County with nearby schools including Carrollton Elementary School, Carrollton Upper Elementary School, and Carrollton Middle School.
Ownership History
Date
Name
Owned For
Owner Type
Purchase Details
Closed on
Jun 21, 2019
Sold by
Mclendon Charles M
Bought by
Posey Christopher B and Posey Amanda Y
Current Estimated Value
Home Financials for this Owner
Home Financials are based on the most recent Mortgage that was taken out on this home.
Original Mortgage
$163,440
Outstanding Balance
$143,412
Interest Rate
4%
Estimated Equity
$111,256
Purchase Details
Closed on
Jul 7, 2002
Sold by
Kenimer Marvin Heirs
Bought by
Kenimer Edna
Purchase Details
Closed on
Jun 7, 2002
Sold by
Kenimer Robert
Bought by
Kenimer Edna
Purchase Details
Closed on
Jan 1, 2001
Sold by
Kenimer Marvin and Kenimer Edn
Bought by
Kenimer Edna
Purchase Details
Closed on
Jan 25, 1983
Bought by
Kenimer Marvin and Kenimer Edn
Create a Home Valuation Report for This Property
The Home Valuation Report is an in-depth analysis detailing your home's value as well as a comparison with similar homes in the area
Home Values in the Area
Average Home Value in this Area
Purchase History
| Date | Buyer | Sale Price | Title Company |
|---|---|---|---|
| Posey Christopher B | $160,000 | -- | |
| Kenimer Edna | -- | -- | |
| Kenimer Edna | -- | -- | |
| Mclendon Charles M | $70,000 | -- | |
| Kenimer Edna | -- | -- | |
| Kenimer Marvin | -- | -- |
Source: Public Records
Mortgage History
| Date | Status | Borrower | Loan Amount |
|---|---|---|---|
| Open | Posey Christopher B | $163,440 |
Source: Public Records
Tax History Compared to Growth
Tax History
| Year | Tax Paid | Tax Assessment Tax Assessment Total Assessment is a certain percentage of the fair market value that is determined by local assessors to be the total taxable value of land and additions on the property. | Land | Improvement |
|---|---|---|---|---|
| 2024 | $2,082 | $76,186 | $29,548 | $46,638 |
| 2023 | $2,082 | $72,005 | $29,549 | $42,456 |
| 2022 | $1,568 | $53,723 | $19,699 | $34,024 |
| 2021 | $1,279 | $43,831 | $14,580 | $29,251 |
| 2020 | $1,194 | $40,876 | $14,580 | $26,296 |
| 2019 | $1,143 | $38,750 | $14,580 | $24,170 |
| 2018 | $1,071 | $35,790 | $14,580 | $21,210 |
| 2017 | $1,077 | $35,790 | $14,580 | $21,210 |
| 2016 | $1,083 | $35,790 | $14,580 | $21,210 |
| 2015 | $922 | $29,866 | $5,760 | $24,106 |
| 2014 | $926 | $29,866 | $5,760 | $24,106 |
Source: Public Records
Map
Nearby Homes
- 105 Haygood Place
- 141 Bowen St
- 142 Griffin Dr
- 516 Longview St
- 117 Orion Terrace
- 308 Old Mill Dr
- 98 Millstream Ct
- 166 Maple St
- 74 Old Mill Ct
- 0 Hwy 27 None N
- 219 Broad St
- 223 Sunset Blvd
- 1818 Maple St
- 160 Watson St
- 27 South St
- 109 S Park St
- 301 Bradley St
- 301 C4 Bradley St
- 423 Clifton Terrace
- 105 Mara St
- 106 Carter Ave
- 116 Carter Ave
- 0 Carter Ave Unit 7488181
- 0 Carter Ave Unit 7428256
- 0 Carter Ave Unit 7146780
- 105 Carter Ave
- 102 Carter Ave
- 109 Carter Ave
- 0 Beaver St Unit 7576129
- 0 Beaver St Unit 8682145
- 101 Carter Ave
- 120 Carter Ave
- 105 N Nixon St
- 712 Longview St
- 212 Ferndale Rd
- 126 Carter Ave
- 702 Longview St
- 720 Longview St
- 103 N Nixon St
- 120 Beavers St