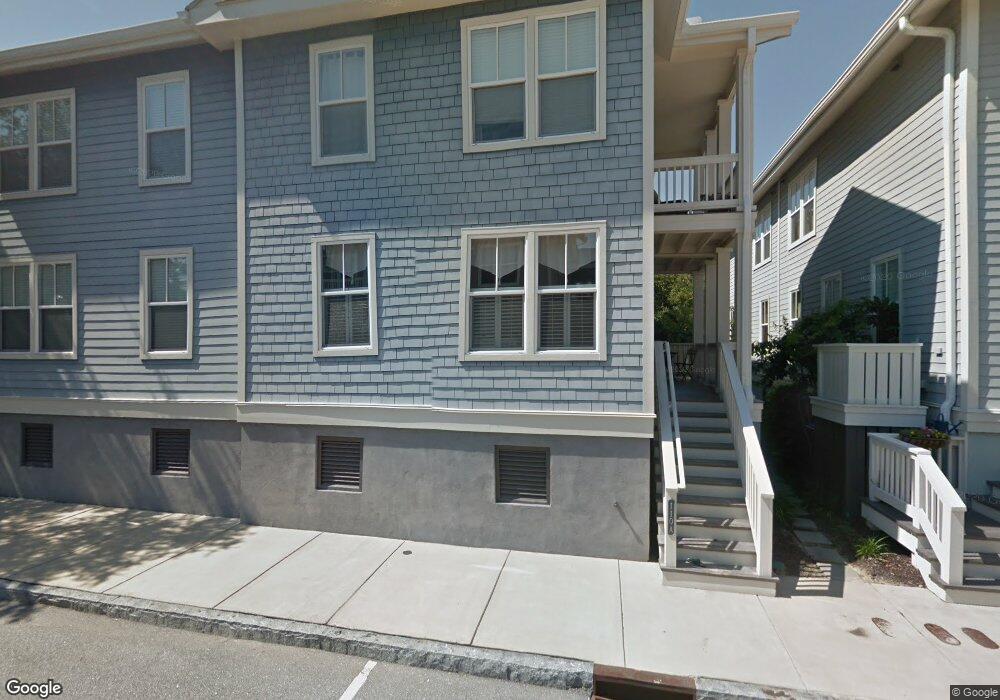
110 Charlesfort Alley Unit 110C Charleston, SC 29403
Wagener Terrace NeighborhoodEstimated Value: $234,000 - $539,000
3
Beds
2
Baths
1,126
Sq Ft
$331/Sq Ft
Est. Value
About This Home
This home is located at 110 Charlesfort Alley Unit 110C, Charleston, SC 29403 and is currently estimated at $373,205, approximately $331 per square foot. 110 Charlesfort Alley Unit 110C is a home located in Charleston County with nearby schools including James Simons Elementary School, Mitchell Elementary School, and Simmons Pinckney Middle.
Ownership History
Date
Name
Owned For
Owner Type
Purchase Details
Closed on
Aug 21, 2009
Sold by
City Of Charleston
Bought by
Black Marva A
Current Estimated Value
Home Financials for this Owner
Home Financials are based on the most recent Mortgage that was taken out on this home.
Original Mortgage
$20,000
Outstanding Balance
$5,783
Interest Rate
5.14%
Mortgage Type
Unknown
Estimated Equity
$367,422
Purchase Details
Closed on
Jun 10, 2009
Sold by
Beach Shoreview Llc
Bought by
City Of Charleston
Create a Home Valuation Report for This Property
The Home Valuation Report is an in-depth analysis detailing your home's value as well as a comparison with similar homes in the area
Home Values in the Area
Average Home Value in this Area
Purchase History
| Date | Buyer | Sale Price | Title Company |
|---|---|---|---|
| Black Marva A | $140,750 | -- | |
| City Of Charleston | $5,344,000 | -- |
Source: Public Records
Mortgage History
| Date | Status | Borrower | Loan Amount |
|---|---|---|---|
| Open | Black Marva A | $20,000 | |
| Open | Black Marva A | $115,897 |
Source: Public Records
Tax History Compared to Growth
Tax History
| Year | Tax Paid | Tax Assessment Tax Assessment Total Assessment is a certain percentage of the fair market value that is determined by local assessors to be the total taxable value of land and additions on the property. | Land | Improvement |
|---|---|---|---|---|
| 2024 | $1,001 | $6,900 | $0 | $0 |
| 2023 | $1,001 | $6,900 | $0 | $0 |
| 2022 | $907 | $6,900 | $0 | $0 |
| 2021 | $949 | $6,900 | $0 | $0 |
| 2020 | $982 | $6,900 | $0 | $0 |
| 2019 | $880 | $6,000 | $0 | $0 |
| 2017 | $851 | $6,000 | $0 | $0 |
| 2016 | $818 | $6,000 | $0 | $0 |
| 2015 | $844 | $6,000 | $0 | $0 |
| 2014 | $777 | $0 | $0 | $0 |
| 2011 | -- | $0 | $0 | $0 |
Source: Public Records
Map
Nearby Homes
- 62 Alberta Ave
- 64 Alberta Ave
- 32 Alberta Ave
- 172 Mary Ellen Dr
- 4 Piedmont Ave
- 2 Piedmont Ave
- 117 Peachtree St
- 79 Hester St
- 40 Piedmont Ave
- 829 Rutledge Ave
- 17 8th Ave Unit A
- 17 8th Ave Unit 17 D
- 261 Grove St
- 8 Riverside Dr
- 2 Gordon St
- 814 Rutledge Ave
- 78 Maple St
- 782 Rutledge Ave Unit D
- 320 Grove St
- 9 Magnolia Ave
- 110 Charlesfort Alley Unit D
- 110 Charlesfort Alley Unit B
- 110 Charlesfort Alley Unit A
- 108 Charlesfort Alley Unit 108D
- 108 Charlesfort Alley Unit 108C
- 108 Charlesfort Alley Unit B
- 108 Charlesfort Alley Unit A
- 106 Charlesfort Alley Unit D
- 106 Charlesfort Alley Unit 106C
- 106 Charlesfort Alley Unit B
- 104 Charlesfort Alley Unit 104D
- 104 Charlesfort Alley Unit 104C
- 104 Charlesfort Alley Unit A
- 107 Charlesfort Alley Unit D
- 107 Charlesfort Alley Unit C
- 107 Charlesfort Alley Unit B
- 107 Charlesfort Alley Unit A
- 109 Charlesfort Alley Unit 109E
- 109 Charlesfort Alley Unit D
- 109 Charlesfort Alley Unit C