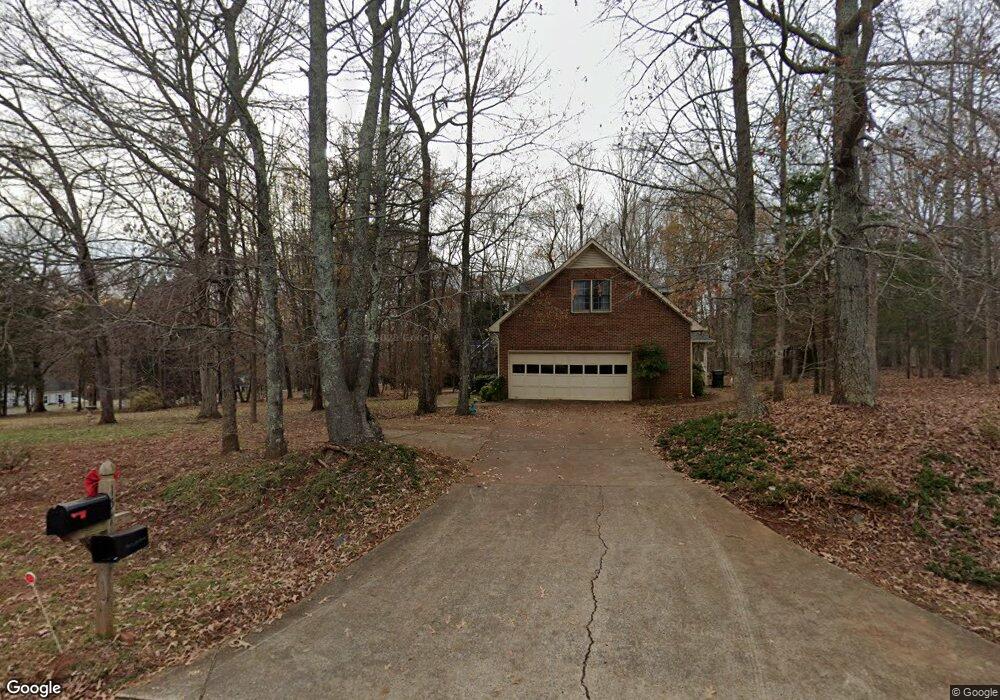
110 Chasestone Ct Waxhaw, NC 28173
Estimated Value: $322,000 - $623,109
3
Beds
3
Baths
2,559
Sq Ft
$189/Sq Ft
Est. Value
About This Home
This home is located at 110 Chasestone Ct, Waxhaw, NC 28173 and is currently estimated at $484,777, approximately $189 per square foot. 110 Chasestone Ct is a home located in Union County with nearby schools including Rea View Elementary School, Weddington Middle School, and Weddington High School.
Ownership History
Date
Name
Owned For
Owner Type
Purchase Details
Closed on
Jun 23, 2022
Sold by
Cendejas Gilbert C and Cendejas Teresa K
Bought by
Neve Christopher and Neve Daniela
Current Estimated Value
Home Financials for this Owner
Home Financials are based on the most recent Mortgage that was taken out on this home.
Original Mortgage
$219,900
Outstanding Balance
$204,851
Interest Rate
3.5%
Mortgage Type
New Conventional
Estimated Equity
$279,926
Purchase Details
Closed on
Jun 12, 2014
Sold by
Beam Julie M
Bought by
Cendejas Gilbert C and Cendejas Teresa K
Home Financials for this Owner
Home Financials are based on the most recent Mortgage that was taken out on this home.
Original Mortgage
$245,471
Interest Rate
3.87%
Mortgage Type
FHA
Purchase Details
Closed on
Mar 20, 2008
Sold by
Beam Timothy Earl
Bought by
Beam Julie Morgan
Home Financials for this Owner
Home Financials are based on the most recent Mortgage that was taken out on this home.
Original Mortgage
$130,000
Interest Rate
5.84%
Mortgage Type
New Conventional
Create a Home Valuation Report for This Property
The Home Valuation Report is an in-depth analysis detailing your home's value as well as a comparison with similar homes in the area
Purchase History
| Date | Buyer | Sale Price | Title Company |
|---|---|---|---|
| Neve Christopher | $550,000 | None Listed On Document | |
| Cendejas Gilbert C | $250,000 | Investors Title Insurance Co | |
| Beam Julie Morgan | -- | None Available |
Source: Public Records
Mortgage History
| Date | Status | Borrower | Loan Amount |
|---|---|---|---|
| Open | Neve Christopher | $219,900 | |
| Previous Owner | Cendejas Gilbert C | $245,471 | |
| Previous Owner | Beam Julie Morgan | $130,000 |
Source: Public Records
Tax History
| Year | Tax Paid | Tax Assessment Tax Assessment Total Assessment is a certain percentage of the fair market value that is determined by local assessors to be the total taxable value of land and additions on the property. | Land | Improvement |
|---|---|---|---|---|
| 2025 | $2,767 | $553,800 | $0 | $0 |
| 2024 | $2,445 | $334,100 | $89,400 | $244,700 |
| 2023 | $2,115 | $334,100 | $89,400 | $244,700 |
| 2022 | $2,125 | $334,100 | $89,400 | $244,700 |
| 2021 | $2,125 | $334,100 | $89,400 | $244,700 |
| 2020 | $1,831 | $250,520 | $46,720 | $203,800 |
| 2019 | $1,961 | $250,520 | $46,720 | $203,800 |
| 2018 | $1,831 | $250,520 | $46,720 | $203,800 |
| 2017 | $1,956 | $250,500 | $46,700 | $203,800 |
| 2016 | $2,050 | $250,520 | $46,720 | $203,800 |
| 2015 | $1,945 | $250,520 | $46,720 | $203,800 |
| 2014 | $1,702 | $240,870 | $77,130 | $163,740 |
Source: Public Records
Map
Nearby Homes
- 4023 Blossom Hill Dr
- 6042 Foggy Glen Place
- 8714 Southshore Dr
- 504 Bear Paw Dr
- 5101 Belicourt Dr
- 8716 Ruby Hill Ct
- 8706 Ruby Hill Ct
- 12415 Darby Chase Dr
- 00 Providence Rd
- 6805 Weddington Matthews Rd
- 6823 Weddington Matthews Rd
- 6901 Weddington Matthews Rd
- 8700 Longview Club Dr
- 12018 Delmahoy Dr
- 5512 Bellerive Ct
- 200 Weddington Rd
- 433 Landsbury Dr
- 208 Pumpkin Seed Ct
- 104 Crest Ct
- 213 Crest Ct
- 110 Chasestone Ct Unit 64
- 157 Valley Glen Dr
- 114 Chasestone Ct
- 173 Valley Glen Dr
- 118 Chasestone Ct
- 109 Chasestone Ct
- 113 Chasestone Ct
- 107 Valley Glen Dr
- 152 Valley Glen Dr
- 156 Valley Glen Dr
- 162 Valley Glen Dr
- 185 Valley Glen Dr
- 168 Valley Glen Dr
- 117 Chasestone Ct
- 146 Valley Glen Dr
- 7033 Willow Trace Ln
- 176 Valley Glen Dr
- 7029 Willow Trace Ln
- 140 Valley Glen Dr
- 7025 Willow Trace Ln Unit 64
Your Personal Tour Guide
Ask me questions while you tour the home.