110 Chestnut St Brookline, MA 02445
Brookline Village NeighborhoodEstimated Value: $1,667,000 - $2,048,000
4
Beds
2
Baths
1,879
Sq Ft
$953/Sq Ft
Est. Value
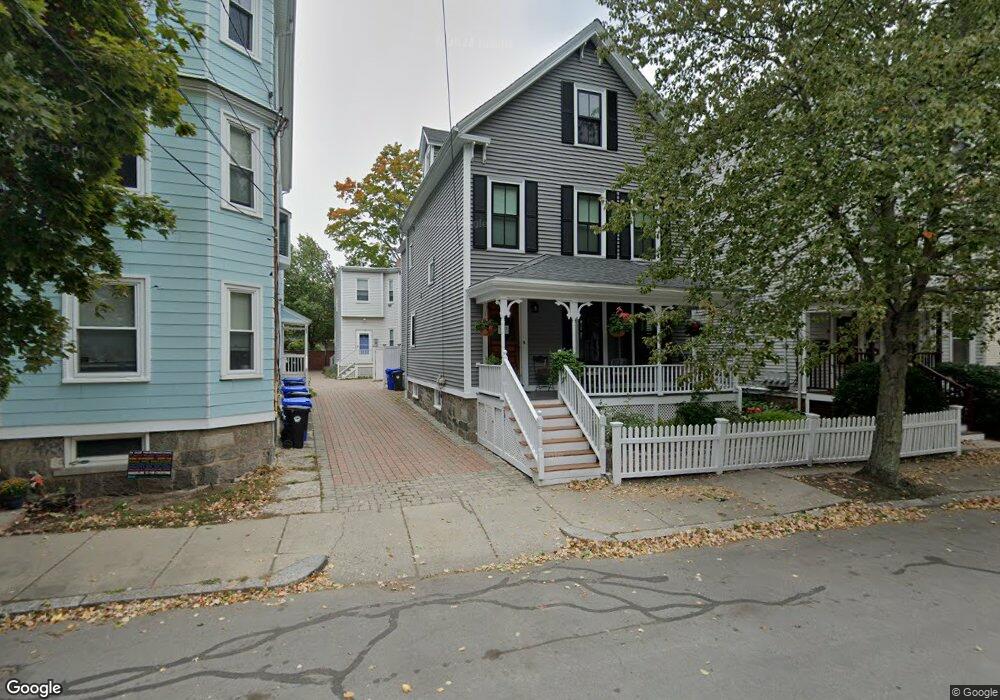
About This Home
This home is located at 110 Chestnut St, Brookline, MA 02445 and is currently estimated at $1,789,978, approximately $952 per square foot. 110 Chestnut St is a home located in Norfolk County with nearby schools including William H. Lincoln School, St. Mary of the Assumption Elementary School, and Maimonides School.
Ownership History
Date
Name
Owned For
Owner Type
Purchase Details
Closed on
Mar 12, 2001
Sold by
Silberberg Susan S
Bought by
Strom Adam and Garces Sandy Ms
Current Estimated Value
Purchase Details
Closed on
Aug 13, 1998
Sold by
Bullard D Rita
Bought by
Silberberg Ross and Silberberg Susan C
Create a Home Valuation Report for This Property
The Home Valuation Report is an in-depth analysis detailing your home's value as well as a comparison with similar homes in the area
Home Values in the Area
Average Home Value in this Area
Purchase History
| Date | Buyer | Sale Price | Title Company |
|---|---|---|---|
| Strom Adam | $535,000 | -- | |
| Silberberg Ross | $295,000 | -- |
Source: Public Records
Mortgage History
| Date | Status | Borrower | Loan Amount |
|---|---|---|---|
| Open | Silberberg Ross | $407,000 | |
| Closed | Silberberg Ross | $417,000 |
Source: Public Records
Tax History Compared to Growth
Tax History
| Year | Tax Paid | Tax Assessment Tax Assessment Total Assessment is a certain percentage of the fair market value that is determined by local assessors to be the total taxable value of land and additions on the property. | Land | Improvement |
|---|---|---|---|---|
| 2025 | $13,228 | $1,340,200 | $662,800 | $677,400 |
| 2024 | $12,556 | $1,285,200 | $637,200 | $648,000 |
| 2023 | $11,846 | $1,188,200 | $553,400 | $634,800 |
| 2022 | $11,531 | $1,131,600 | $527,100 | $604,500 |
| 2021 | $10,663 | $1,088,100 | $506,800 | $581,300 |
| 2020 | $9,760 | $1,032,800 | $460,700 | $572,100 |
| 2019 | $9,217 | $983,700 | $438,800 | $544,900 |
| 2018 | $8,653 | $914,700 | $377,700 | $537,000 |
| 2017 | $8,525 | $862,900 | $356,300 | $506,600 |
| 2016 | $8,404 | $806,500 | $333,000 | $473,500 |
| 2015 | $8,050 | $753,700 | $311,200 | $442,500 |
| 2014 | $8,167 | $717,000 | $282,900 | $434,100 |
Source: Public Records
Map
Nearby Homes
- 105 Franklin St Unit 1
- 18 Chestnut Place
- 20 Rice St Unit 2
- 241 Perkins St Unit C306
- 241 Perkins St Unit C402
- 241 Perkins St Unit D405
- 21 Sargent Crossway
- 18 Cushing Rd
- 81 Glen Rd Unit S2
- 60 Glen Rd Unit 101
- 371 Walnut St
- 36 Allerton St
- 111 Perkins St Unit 108
- 111 Perkins St Unit 282
- 111 Perkins St Unit 121
- 111 Perkins St Unit 152
- 99 Pond Ave Unit 608
- 72 Cypress St Unit 1
- 332 Jamaicaway Unit 406
- 487 Boylston St Unit 3
- 110A Chestnut St Unit 2
- 110A Chestnut St Unit 1
- 110A Chestnut St
- 112 Chestnut St Unit 3
- 112 Chestnut St Unit 2
- 112 Chestnut St Unit 1
- 112 Chestnut St Unit A
- 112A Chestnut St
- 112A Chestnut St Unit 1
- 112A Chestnut St
- 112A Chestnut St Unit 2
- 108 Chestnut St
- 108 Chestnut St Unit 2
- 108 Chestnut St Unit 1
- 100 Chestnut St
- 98 Chestnut St
- 98 Chestnut St
- 98 Chestnut St Unit 2
- 98 Chestnut St Unit 1
- 114 Chestnut St Unit 2