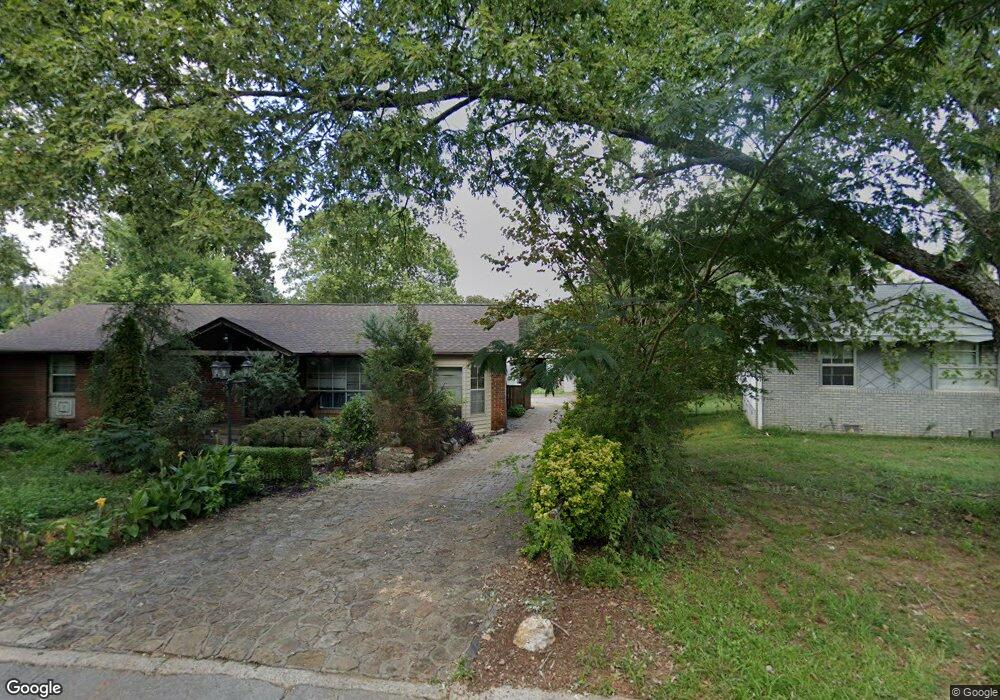
110 Chisholm Trail NW Dalton, GA 30721
Estimated Value: $196,940 - $237,000
4
Beds
2
Baths
1,375
Sq Ft
$158/Sq Ft
Est. Value
About This Home
This home is located at 110 Chisholm Trail NW, Dalton, GA 30721 and is currently estimated at $217,235, approximately $157 per square foot. 110 Chisholm Trail NW is a home located in Whitfield County with nearby schools including Varnell Elementary School, Coahulla Creek High School, and Cedar Valley Christian Academy.
Ownership History
Date
Name
Owned For
Owner Type
Purchase Details
Closed on
Apr 3, 2015
Sold by
Sandoval Claudia
Bought by
Sandoval Arnulfo and Sandoval Maria De Lourdes
Current Estimated Value
Home Financials for this Owner
Home Financials are based on the most recent Mortgage that was taken out on this home.
Original Mortgage
$73,641
Outstanding Balance
$26,716
Interest Rate
3.5%
Mortgage Type
FHA
Estimated Equity
$190,519
Purchase Details
Closed on
Oct 20, 2006
Sold by
Gomez Adrian A
Bought by
Oceguera Claudia M
Home Financials for this Owner
Home Financials are based on the most recent Mortgage that was taken out on this home.
Original Mortgage
$87,600
Interest Rate
6.31%
Mortgage Type
New Conventional
Purchase Details
Closed on
Dec 31, 2002
Sold by
Sissom Trevor L and Sissom Echols
Bought by
Gomez Adrian A
Purchase Details
Closed on
May 1, 1997
Bought by
Sissom Trevor L and Sissom Echols
Create a Home Valuation Report for This Property
The Home Valuation Report is an in-depth analysis detailing your home's value as well as a comparison with similar homes in the area
Home Values in the Area
Average Home Value in this Area
Purchase History
| Date | Buyer | Sale Price | Title Company |
|---|---|---|---|
| Sandoval Arnulfo | $75,000 | -- | |
| Oceguera Claudia M | $109,500 | -- | |
| Gomez Adrian A | $87,500 | -- | |
| Sissom Trevor L | $78,000 | -- |
Source: Public Records
Mortgage History
| Date | Status | Borrower | Loan Amount |
|---|---|---|---|
| Open | Sandoval Arnulfo | $73,641 | |
| Previous Owner | Oceguera Claudia M | $87,600 |
Source: Public Records
Tax History Compared to Growth
Tax History
| Year | Tax Paid | Tax Assessment Tax Assessment Total Assessment is a certain percentage of the fair market value that is determined by local assessors to be the total taxable value of land and additions on the property. | Land | Improvement |
|---|---|---|---|---|
| 2024 | $1,325 | $74,792 | $10,400 | $64,392 |
| 2023 | $1,325 | $48,065 | $9,600 | $38,465 |
| 2022 | $993 | $39,124 | $7,000 | $32,124 |
| 2021 | $993 | $39,124 | $7,000 | $32,124 |
| 2020 | $1,013 | $39,124 | $7,000 | $32,124 |
| 2019 | $1,023 | $39,124 | $7,000 | $32,124 |
| 2018 | $1,034 | $39,124 | $7,000 | $32,124 |
| 2017 | $883 | $34,666 | $4,200 | $30,466 |
| 2016 | $607 | $26,772 | $3,570 | $23,202 |
| 2014 | $541 | $25,249 | $4,200 | $21,049 |
| 2013 | -- | $25,248 | $4,200 | $21,048 |
Source: Public Records
Map
Nearby Homes
- 194 Cheyenne Trail NW
- 00 Cleveland Hwy
- 154 Brylow Dr Unit 92, pt 91
- 3250 Rolling Meadows Rd NW
- 0 Highway 2 Unit 1507324
- 0 Highway 2 Unit 1507220
- 0 Highway 2 Unit 1507215
- 316 Maple Grove Rd NW
- 204 Old Praters Mill Rd NE
- 3922 Georgia 2
- 204 Old Prater Mill Rd NE
- 0 Oakstone Way NW Unit 125185
- 213 Oakstone Way
- 124 Timbervale Dr
- 1055 Durham St
- 329 Kempton Ln
- 3050 Cleveland Hwy
- 3450 Misty Meadows Dr NW
- 360 Pacer Ln
- 0 Cleveland Hwy
- 110 Chisholm Cir NW
- 112 Chisholm Trail NW
- 108 Chisholm Trail NW
- 114 Chisholm Trail NW
- 114 Chisholm Cir NW
- 106 Chisholm Cir NW
- 106 Chisholm Trail NW
- 106 Chisholm Trail NW
- 107 Chisholm Trail NW
- 105 Chisholm Trail NW
- 116 Chisholm Cir NW
- 116 Chisholm Tr
- 109 Chisholm Trail NW
- 116 Chisholm Trail NW Unit 9 & pt10
- 116 Chisholm Trail NW
- 104 Chisholm Cir NW
- 104 Chisholm Trail NW
- 103 Chisholm Trail NW
- 111 Chisholm Trail NW
- 118 Abilene Trail