Estimated Value: $169,000 - $278,000
4
Beds
2
Baths
1,636
Sq Ft
$146/Sq Ft
Est. Value
About This Home
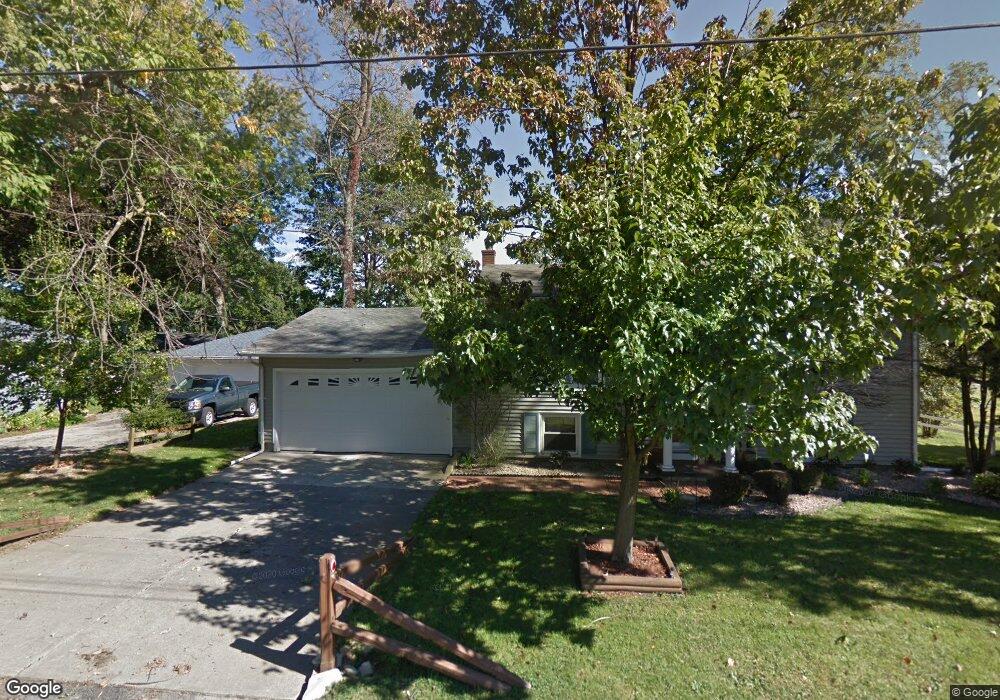
This home is located at 110 Cincinnati Ave, Huron, OH 44839 and is currently estimated at $239,043, approximately $146 per square foot. 110 Cincinnati Ave is a home located in Erie County with nearby schools including Woodlands Intermediate School, Shawnee Elementary School, and McCormick Junior High School.
Ownership History
Date
Name
Owned For
Owner Type
Purchase Details
Closed on
Aug 13, 2020
Sold by
Seibel Charles G
Bought by
Ervin Jerry A
Current Estimated Value
Purchase Details
Closed on
May 27, 2014
Sold by
Seibel Karyn P and Seibel Charles G
Bought by
Seibel Charles G
Purchase Details
Closed on
Sep 21, 2005
Sold by
Cornell Grant L and Branham Donell A
Bought by
Seibel Charles G and Seibel Karyn P
Home Financials for this Owner
Home Financials are based on the most recent Mortgage that was taken out on this home.
Original Mortgage
$108,000
Interest Rate
5.88%
Mortgage Type
New Conventional
Purchase Details
Closed on
Nov 25, 1996
Sold by
Holzhauer Carol N
Bought by
Cornell Grant L and Branham Donell A
Create a Home Valuation Report for This Property
The Home Valuation Report is an in-depth analysis detailing your home's value as well as a comparison with similar homes in the area
Home Values in the Area
Average Home Value in this Area
Purchase History
| Date | Buyer | Sale Price | Title Company |
|---|---|---|---|
| Ervin Jerry A | $85,000 | Hartung Title Order | |
| Seibel Charles G | -- | None Available | |
| Seibel Charles G | $147,900 | Southern Title Of Ohio Ltd | |
| Cornell Grant L | $108,000 | -- |
Source: Public Records
Mortgage History
| Date | Status | Borrower | Loan Amount |
|---|---|---|---|
| Previous Owner | Seibel Charles G | $108,000 |
Source: Public Records
Tax History
| Year | Tax Paid | Tax Assessment Tax Assessment Total Assessment is a certain percentage of the fair market value that is determined by local assessors to be the total taxable value of land and additions on the property. | Land | Improvement |
|---|---|---|---|---|
| 2024 | $2,089 | $57,865 | $12,180 | $45,685 |
| 2023 | $2,486 | $51,887 | $10,780 | $41,107 |
| 2022 | $2,203 | $51,887 | $10,780 | $41,107 |
| 2021 | $2,198 | $51,890 | $10,780 | $41,110 |
| 2020 | $1,809 | $42,640 | $10,780 | $31,860 |
| 2019 | $1,889 | $42,640 | $10,780 | $31,860 |
| 2018 | $1,899 | $42,640 | $10,780 | $31,860 |
| 2017 | $1,955 | $42,660 | $12,080 | $30,580 |
| 2016 | $1,893 | $42,660 | $12,080 | $30,580 |
| 2015 | $1,891 | $42,660 | $12,080 | $30,580 |
| 2014 | $1,913 | $42,660 | $12,080 | $30,580 |
| 2013 | $1,885 | $42,660 | $12,080 | $30,580 |
Source: Public Records
Map
Nearby Homes
- 201 Dayton Ave
- 41 Poplar St
- 2016 Cleveland Rd W
- 41 Richland Ave
- 220 Overlook Rd
- 2008 Shore Dr
- 122 Atwood Place
- 224 Atwood Place
- 0 Bucyrus Ave
- 526 Mariner Village
- 527 Mariner Village
- 1361 Cleveland Rd W Unit C
- 1208 Cleveland Rd W
- 1 Cleveland Rd W
- 721 Creekside Dr
- 706 Creekside Dr
- 11 Turtle Bay
- 720 Tracht Meadows Dr
- 0 Bogart Rd
- 919 Glenview Dr
- 114 Cincinnati Ave
- 0 Cincinnati Ave
- 104 Cincinnati Ave
- 105 Dayton Ave
- 107 Cincinnati Ave
- 109 Cincinnati Ave
- 103 Dayton Ave
- 0 Dayton Ave
- 103 Cincinnati Ave
- 111 Cincinnati Ave
- 106 Dayton Ave
- 201 Dayton Ave
- 110 Dayton Ave
- 110 Dayton Ave
- 27 Dayton Ave
- 36 Cincinnati Ave
- 124 Woodside Ave
- 202 Woodside Ave
- 118 Cincinnati Ave
- 104 Dayton Ave
Your Personal Tour Guide
Ask me questions while you tour the home.