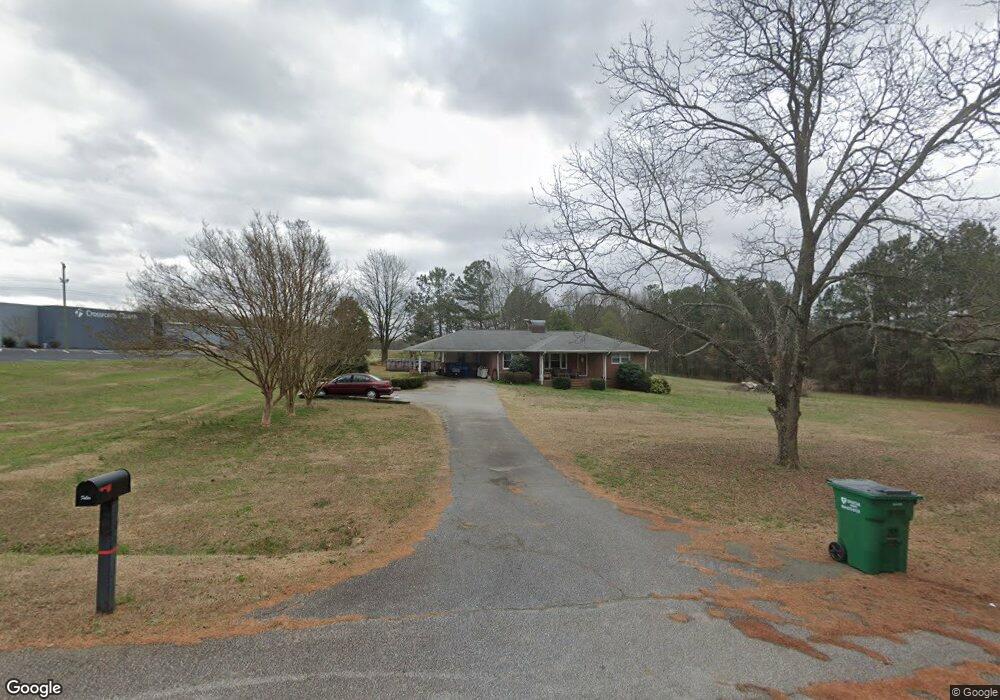
110 Conway Black Rd Spartanburg, SC 29307
Estimated Value: $190,000 - $224,790
2
Beds
2
Baths
1,459
Sq Ft
$147/Sq Ft
Est. Value
About This Home
This home is located at 110 Conway Black Rd, Spartanburg, SC 29307 and is currently estimated at $214,948, approximately $147 per square foot. 110 Conway Black Rd is a home located in Spartanburg County with nearby schools including Broome High School and Mountain View Christian Academy.
Ownership History
Date
Name
Owned For
Owner Type
Purchase Details
Closed on
Oct 23, 2020
Sold by
Sprinkletown Properties Llc
Bought by
Fuller Robert A
Current Estimated Value
Home Financials for this Owner
Home Financials are based on the most recent Mortgage that was taken out on this home.
Original Mortgage
$140,000
Outstanding Balance
$124,523
Interest Rate
2.9%
Mortgage Type
Unknown
Estimated Equity
$90,425
Purchase Details
Closed on
Oct 21, 2020
Sold by
Easler Pauline B and Wilson Ted Barber
Bought by
Sprinkletown Properties Llc
Home Financials for this Owner
Home Financials are based on the most recent Mortgage that was taken out on this home.
Original Mortgage
$140,000
Outstanding Balance
$124,523
Interest Rate
2.9%
Mortgage Type
Unknown
Estimated Equity
$90,425
Purchase Details
Closed on
Nov 6, 2013
Sold by
Easler Pauline B
Bought by
Easler Pauline B and Wilson Ted Barber
Create a Home Valuation Report for This Property
The Home Valuation Report is an in-depth analysis detailing your home's value as well as a comparison with similar homes in the area
Home Values in the Area
Average Home Value in this Area
Purchase History
| Date | Buyer | Sale Price | Title Company |
|---|---|---|---|
| Fuller Robert A | $140,000 | None Available | |
| Fuller Robert A | $140,000 | None Available | |
| Sprinkletown Properties Llc | $142,000 | None Available | |
| Easler Pauline B | -- | -- |
Source: Public Records
Mortgage History
| Date | Status | Borrower | Loan Amount |
|---|---|---|---|
| Open | Fuller Robert A | $140,000 | |
| Closed | Fuller Robert A | $140,000 |
Source: Public Records
Tax History Compared to Growth
Tax History
| Year | Tax Paid | Tax Assessment Tax Assessment Total Assessment is a certain percentage of the fair market value that is determined by local assessors to be the total taxable value of land and additions on the property. | Land | Improvement |
|---|---|---|---|---|
| 2025 | $1,144 | $6,312 | $856 | $5,456 |
| 2024 | $1,144 | $6,312 | $856 | $5,456 |
| 2023 | $1,144 | $6,312 | $856 | $5,456 |
| 2022 | $1,042 | $5,592 | $720 | $4,872 |
| 2021 | $3,805 | $5,592 | $720 | $4,872 |
| 2020 | $540 | $4,789 | $949 | $3,840 |
| 2019 | $614 | $4,789 | $949 | $3,840 |
| 2018 | $503 | $4,789 | $949 | $3,840 |
| 2017 | $405 | $6,246 | $1,488 | $4,758 |
| 2016 | $403 | $6,246 | $1,488 | $4,758 |
| 2015 | $397 | $6,246 | $1,488 | $4,758 |
| 2014 | $391 | $6,246 | $1,488 | $4,758 |
Source: Public Records
Map
Nearby Homes
- 000 Burns Rd Unit LOT 1
- 000 Burns Rd
- 000 Burns Rd Unit LOT 2
- 49 Thurgood Marshall Rd
- 204 Bennett Dairy Rd
- 215 Penny Bennett Rd
- 124 Childress Rd
- Lot 31 State Road S-42-2288
- 1926 Bud Arthur Bridge Rd
- Lot 20 Peach Valley Cir
- 112 Riverview Park
- 2959 Chesnee Hwy
- 302 Peach Valley Dr
- 230 Idlewood Cir
- 451 Old Chesnee Hwy
- 455 Old Chesnee Hwy
- 459 Old Chesnee Hwy
- 655 Idlewood Cir
- 415 Ware Rd
- 134 Harvest Moon Ln
- 120 Conway Black Rd
- 490 Rupe Easler Dr
- 445 Rupe Easler Dr
- 145 Vintage Dr
- 1929 Dewberry Rd
- 175 Abbott Ln
- 0 Gossett Rd
- 26 Twin Woods Dr
- 21 Twin Woods Dr
- 283 Vintage Dr
- 1875 Dewberry Rd
- 330 Family Dr Unit 334
- 301 Courtney Louise Ln
- 18 Twin Woods Dr
- 13 Twin Woods Dr
- 306 Enola Station Rd
- 342 Family Dr
- 775 Sha Ln
- 421 Burns Rd Unit LOT 2
- 421 Burns Rd Unit LOT 1