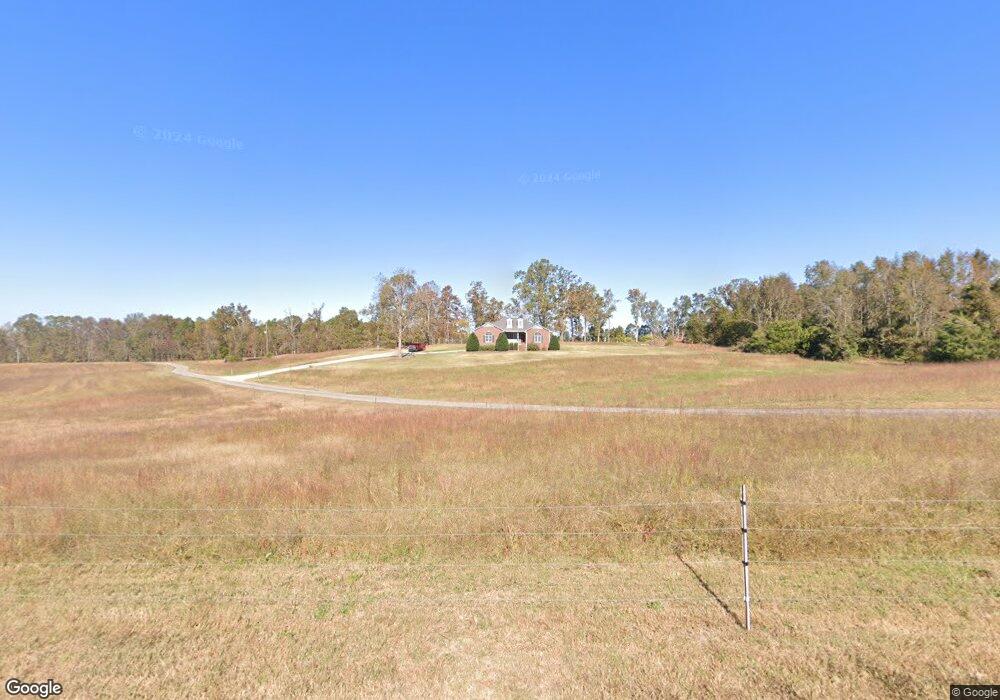
110 Cooper Rd Pauline, SC 29374
Estimated Value: $327,000 - $467,000
3
Beds
2
Baths
2,038
Sq Ft
$187/Sq Ft
Est. Value
About This Home
This home is located at 110 Cooper Rd, Pauline, SC 29374 and is currently estimated at $380,736, approximately $186 per square foot. 110 Cooper Rd is a home located in Spartanburg County with nearby schools including Dorman High School Freshman Campus and Dorman High School.
Ownership History
Date
Name
Owned For
Owner Type
Purchase Details
Closed on
Mar 27, 2025
Sold by
Rogers Micki C and Roddy Micki C
Bought by
Rogers Christopher J and Rogers Micki C
Current Estimated Value
Purchase Details
Closed on
Jun 11, 2020
Sold by
Roddy Sammy E
Bought by
Roddy Micki C
Purchase Details
Closed on
Mar 1, 2007
Sold by
Mcmahon Charles I and Mcmahon Carol P
Bought by
Mcmahon Charles I
Create a Home Valuation Report for This Property
The Home Valuation Report is an in-depth analysis detailing your home's value as well as a comparison with similar homes in the area
Purchase History
| Date | Buyer | Sale Price | Title Company |
|---|---|---|---|
| Rogers Christopher J | -- | None Listed On Document | |
| Roddy Micki C | -- | None Available | |
| Mcmahon Charles I | -- | None Available |
Source: Public Records
Tax History
| Year | Tax Paid | Tax Assessment Tax Assessment Total Assessment is a certain percentage of the fair market value that is determined by local assessors to be the total taxable value of land and additions on the property. | Land | Improvement |
|---|---|---|---|---|
| 2022 | $1,403 | $8,336 | $924 | $7,412 |
| 2021 | $1,418 | $8,336 | $924 | $7,412 |
| 2020 | $1,221 | $7,824 | $867 | $6,957 |
| 2019 | $1,221 | $7,824 | $867 | $6,957 |
| 2018 | $1,221 | $7,824 | $867 | $6,957 |
| 2017 | $1,050 | $6,804 | $740 | $6,064 |
| 2016 | $1,050 | $6,804 | $740 | $6,064 |
| 2015 | $1,045 | $6,804 | $740 | $6,064 |
| 2014 | $1,007 | $6,804 | $740 | $6,064 |
Source: Public Records
Map
Nearby Homes
- 339 Sara Ann Ln
- 0 Bishop Rd Unit 1580027
- 0 Bishop Rd Unit SPN332874
- 319 Gwinn Mill Rd
- 149 Davy Crockett Trail
- 325 Gwinn Mill Rd
- 735 Gwinn Mill Rd
- 1141 Old Hills Bridge Rd
- 0 Marshall Tucker Rd
- 160 Blake Garrison Dr
- 350 W River Grove Cir
- 985 Evins Rd
- 359 W River Grove Cir
- 1491 Harrelson Rd
- 335 Amy Marie Ln
- 245 Thorncrest Dr
- 2109 State Road S-42-90
- Harrison Rd
- Harrison Rd
- 0 Shaw Rd
- 536 Aiken Ct
- 111 Cooper Rd
- 155 Aiken Ct
- 155 Aiken Ct
- 140 Cooper Rd
- 105 Cooper Rd
- 135 Aiken Ct
- 530 Blackstock Rd
- 201 Cooper Rd
- 326 Blackstock Rd
- 101 Aiken Ct
- 542 Blackstock Rd
- 422 Blackstock Rd
- 101 Cooper Rd
- 544 Blackstock Rd
- 531 Blackstock Rd
- 409 Blackstock Rd
- 421 Blackstock Rd
- 630 Blackstock Rd
- 103 Cooper Rd
Your Personal Tour Guide
Ask me questions while you tour the home.