
Seller's Agent in 2025
Jay Liu
Jiang Hua Liu
(617) 642-8668
30 Total Sales
Estimated Value: $1,103,000 - $1,426,000
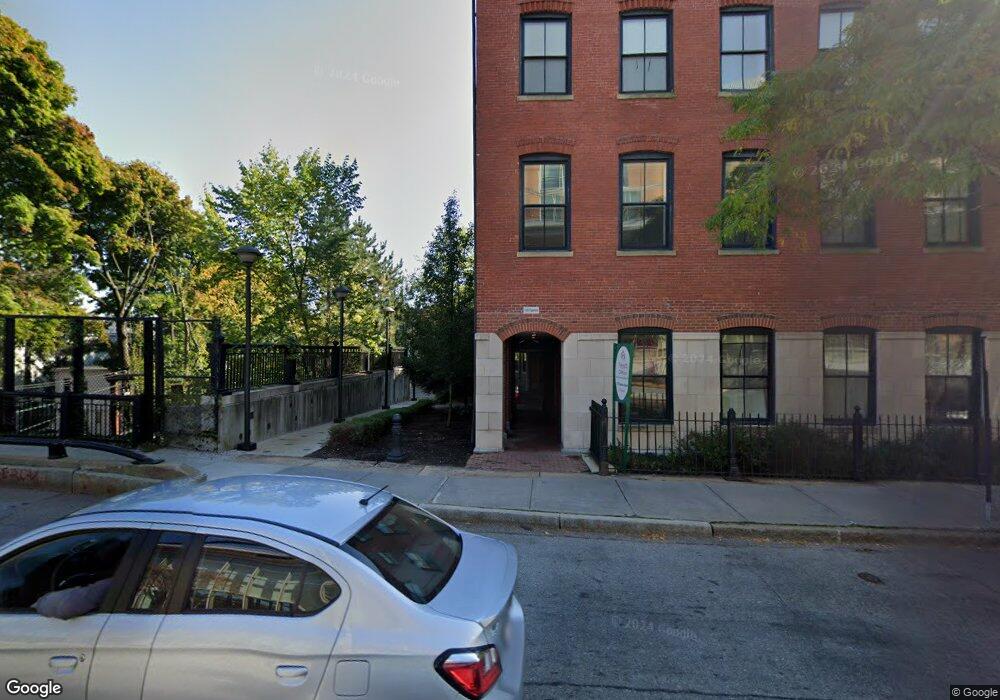
Move in Date - Aug 1st 2025 (8-1-2025), Fully Furnished - Spacious 2 bed 2 bathroom Corner unit, Total of 2 levels (1st floor 1100 Sq ft and lower level 500 Sq ft), a beautiful modern open kitchen with stainless appliances including double wall ovens, dishwasher, disposal, large living room and dinning space, Washer and Dryer inside the unit, comes with 1 Garage parking space . Walk to Green D line - Brookline hills station, Brookline high school. Short commute to Longwood Medical area and Downtown Boston. No pet, No Smoking, No Party. New tenants need to pay $300 move in fee to the Management office.
| Date | Buyer | Sale Price | Title Company |
|---|---|---|---|
| Yuan Yi | $709,000 | -- |
| Date | Status | Borrower | Loan Amount |
|---|---|---|---|
| Open | Yuan Yi | $474,000 |
| Date | Event | Price | List to Sale | Price per Sq Ft |
|---|---|---|---|---|
| 10/01/2025 10/01/25 | Rented | $4,700 | 0.0% | -- |
| 08/18/2025 08/18/25 | Under Contract | -- | -- | -- |
| 08/06/2025 08/06/25 | For Rent | $4,700 | 0.0% | -- |
| 08/06/2025 08/06/25 | Price Changed | $4,700 | -2.1% | $3 / Sq Ft |
| 07/23/2025 07/23/25 | Price Changed | $4,800 | -2.0% | $3 / Sq Ft |
| 06/19/2025 06/19/25 | For Rent | $4,900 | +14.0% | -- |
| 05/14/2020 05/14/20 | Rented | $4,300 | 0.0% | -- |
| 04/27/2020 04/27/20 | Under Contract | -- | -- | -- |
| 04/04/2020 04/04/20 | For Rent | $4,300 | -- | -- |
| Year | Tax Paid | Tax Assessment Tax Assessment Total Assessment is a certain percentage of the fair market value that is determined by local assessors to be the total taxable value of land and additions on the property. | Land | Improvement |
|---|---|---|---|---|
| 2025 | $11,352 | $1,150,200 | $0 | $1,150,200 |
| 2024 | $11,018 | $1,127,700 | $0 | $1,127,700 |
| 2023 | $10,890 | $1,092,300 | $0 | $1,092,300 |
| 2022 | $10,912 | $1,070,900 | $0 | $1,070,900 |
| 2021 | $10,392 | $1,060,400 | $0 | $1,060,400 |
| 2020 | $9,922 | $1,049,900 | $0 | $1,049,900 |
| 2019 | $9,369 | $999,900 | $0 | $999,900 |
| 2018 | $9,078 | $959,600 | $0 | $959,600 |
| 2017 | $8,778 | $888,500 | $0 | $888,500 |
| 2016 | $8,416 | $807,700 | $0 | $807,700 |
| 2015 | $7,842 | $734,300 | $0 | $734,300 |
| 2014 | $7,679 | $674,200 | $0 | $674,200 |
Seller's Agent in 2025
Jay Liu
Jiang Hua Liu
(617) 642-8668
30 Total Sales
S
Buyer's Agent in 2025
Sawako Cross
Oyama Investments, Ltd.