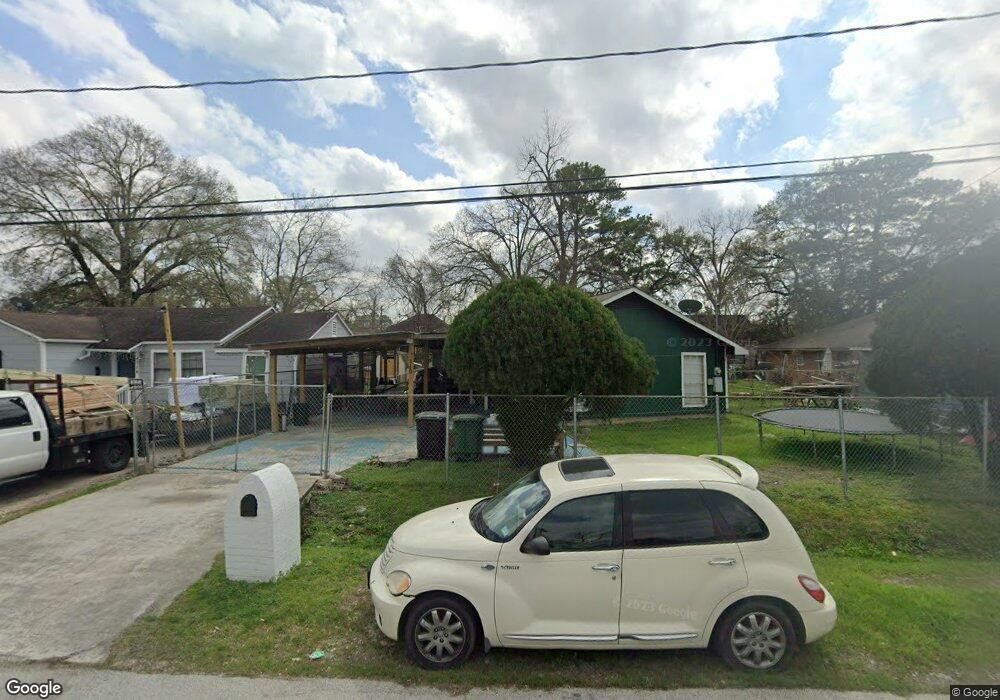
110 De Boll St Houston, TX 77022
Northside-Northline NeighborhoodEstimated Value: $175,461 - $261,000
3
Beds
1
Bath
1,140
Sq Ft
$184/Sq Ft
Est. Value
About This Home
This home is located at 110 De Boll St, Houston, TX 77022 and is currently estimated at $210,115, approximately $184 per square foot. 110 De Boll St is a home located in Harris County with nearby schools including Burbank Elementary School, Burbank Middle School, and Sam Houston Math, Science & Technology Center.
Ownership History
Date
Name
Owned For
Owner Type
Purchase Details
Closed on
Oct 5, 1997
Sold by
Melendez Moises S
Bought by
Turcios Bertha E and Turcios Felix Bonerge
Current Estimated Value
Purchase Details
Closed on
Feb 22, 1996
Sold by
Elliott Ronald Lee
Bought by
Melendez Moises S and Turcios Bertha E
Home Financials for this Owner
Home Financials are based on the most recent Mortgage that was taken out on this home.
Original Mortgage
$43,225
Interest Rate
7.03%
Purchase Details
Closed on
Mar 11, 1994
Sold by
Kerr Betty Denise Elliott and Elliot Betty Denise
Bought by
Elliott Ronald Lee
Create a Home Valuation Report for This Property
The Home Valuation Report is an in-depth analysis detailing your home's value as well as a comparison with similar homes in the area
Home Values in the Area
Average Home Value in this Area
Purchase History
| Date | Buyer | Sale Price | Title Company |
|---|---|---|---|
| Turcios Bertha E | -- | -- | |
| Melendez Moises S | -- | -- | |
| Elliott Ronald Lee | -- | -- |
Source: Public Records
Mortgage History
| Date | Status | Borrower | Loan Amount |
|---|---|---|---|
| Previous Owner | Melendez Moises S | $43,225 |
Source: Public Records
Tax History
| Year | Tax Paid | Tax Assessment Tax Assessment Total Assessment is a certain percentage of the fair market value that is determined by local assessors to be the total taxable value of land and additions on the property. | Land | Improvement |
|---|---|---|---|---|
| 2025 | $2,439 | $154,332 | $75,136 | $79,196 |
| 2024 | $2,439 | $134,700 | $68,957 | $65,743 |
| 2023 | $2,439 | $146,527 | $42,017 | $104,510 |
| 2022 | $2,423 | $124,695 | $42,017 | $82,678 |
| 2021 | $2,331 | $127,379 | $42,017 | $85,362 |
| 2020 | $2,202 | $117,298 | $42,017 | $75,281 |
| 2019 | $2,092 | $115,610 | $34,602 | $81,008 |
| 2018 | $1,227 | $83,963 | $28,917 | $55,046 |
| 2017 | $1,728 | $83,963 | $28,917 | $55,046 |
| 2016 | $1,571 | $71,497 | $27,187 | $44,310 |
| 2015 | $988 | $56,468 | $19,773 | $36,695 |
| 2014 | $988 | $56,468 | $19,773 | $36,695 |
Source: Public Records
Map
Nearby Homes
- 9201 Fulton St
- 253 De Boll St
- 267 De Boll St
- 61 Trenwood Ln
- 56 Trenwood Ln
- 56 Wellford St
- 0 Veenstra St
- 161 Luther St
- 202 Burbank St
- 8715 Bauman Rd Unit 6
- 61 Berry Rd
- 9625 Fulton St
- 9713 Clark Rd
- 9711 Marydel St
- 30 Wellford St
- 91 Burbank St
- 26 Farrell St
- 108 Luetta St
- 219 Heaney Dr
- 9026 Mcgallion Rd
Your Personal Tour Guide
Ask me questions while you tour the home.