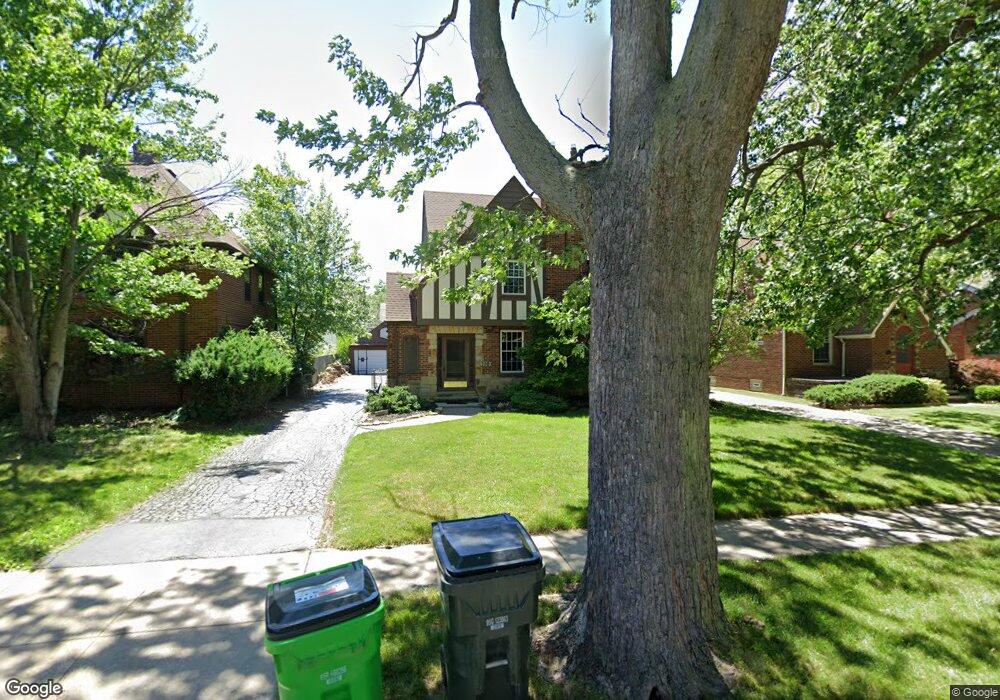
110 E 211th St Euclid, OH 44123
Estimated Value: $203,000 - $244,000
3
Beds
2
Baths
2,238
Sq Ft
$97/Sq Ft
Est. Value
About This Home
This home is located at 110 E 211th St, Euclid, OH 44123 and is currently estimated at $216,078, approximately $96 per square foot. 110 E 211th St is a home located in Cuyahoga County with nearby schools including Arbor Elementary School, Euclid Middle School, and Euclid High School.
Ownership History
Date
Name
Owned For
Owner Type
Purchase Details
Closed on
Feb 27, 2021
Sold by
Petterson Michael K
Bought by
Lrp Mgmt Llc
Current Estimated Value
Purchase Details
Closed on
Mar 17, 2004
Sold by
Nosan Janet H
Bought by
Petterson Michael K
Home Financials for this Owner
Home Financials are based on the most recent Mortgage that was taken out on this home.
Original Mortgage
$148,700
Interest Rate
5.74%
Mortgage Type
Purchase Money Mortgage
Purchase Details
Closed on
Mar 27, 1989
Sold by
Cummins Kevin S
Bought by
Nosan Joseph E
Purchase Details
Closed on
Sep 19, 1985
Sold by
Edward J Hug
Bought by
Cummins Kevin S
Purchase Details
Closed on
Jan 18, 1979
Sold by
Hug Edward J
Bought by
Edward J Hug
Purchase Details
Closed on
Jul 29, 1976
Sold by
Hug Edward J and V M
Bought by
Hug Edward J
Purchase Details
Closed on
Jan 1, 1975
Bought by
Hug Edward J and Hug M
Create a Home Valuation Report for This Property
The Home Valuation Report is an in-depth analysis detailing your home's value as well as a comparison with similar homes in the area
Home Values in the Area
Average Home Value in this Area
Purchase History
| Date | Buyer | Sale Price | Title Company |
|---|---|---|---|
| Lrp Mgmt Llc | -- | Enterprise Title Agency | |
| Petterson Michael K | $175,000 | Ltic | |
| Nosan Joseph E | $106,000 | -- | |
| Cummins Kevin S | $94,800 | -- | |
| Edward J Hug | -- | -- | |
| Hug Edward J | -- | -- | |
| Hug Edward J | -- | -- |
Source: Public Records
Mortgage History
| Date | Status | Borrower | Loan Amount |
|---|---|---|---|
| Previous Owner | Petterson Michael K | $148,700 |
Source: Public Records
Tax History
| Year | Tax Paid | Tax Assessment Tax Assessment Total Assessment is a certain percentage of the fair market value that is determined by local assessors to be the total taxable value of land and additions on the property. | Land | Improvement |
|---|---|---|---|---|
| 2025 | $4,636 | $69,265 | $11,795 | $57,470 |
| 2024 | $4,802 | $69,265 | $11,795 | $57,470 |
| 2023 | $5,098 | $59,050 | $9,770 | $49,280 |
| 2022 | $4,982 | $59,050 | $9,770 | $49,280 |
| 2021 | $5,574 | $59,050 | $9,770 | $49,280 |
| 2020 | $5,657 | $54,670 | $9,030 | $45,640 |
| 2019 | $4,994 | $156,200 | $25,800 | $130,400 |
| 2018 | $5,032 | $54,670 | $9,030 | $45,640 |
| 2017 | $5,452 | $49,360 | $7,670 | $41,690 |
| 2016 | $5,464 | $49,360 | $7,670 | $41,690 |
| 2015 | $4,964 | $49,360 | $7,670 | $41,690 |
| 2014 | $4,964 | $49,360 | $7,670 | $41,690 |
Source: Public Records
Map
Nearby Homes
- 144 E 208th St
- 94 E 217th St
- 226 E 216th St
- 71 E 201st St
- 273 E 208th St
- 285 E 216th St
- 324 E 215th St
- 170 E 220th St
- 336 E 222nd St
- 174 E 200th St
- 21051 S Lake Shore Blvd
- 20330 S Lake Shore Blvd
- 20700 Crystal Ave
- 21000 Crystal Ave
- 80 E 197th St
- 20931 Priday Ave
- 275 E 200th St
- 421 Kenwood Dr Unit G
- 20900 Priday Ave
- 422 Clearview Dr Unit J10
Your Personal Tour Guide
Ask me questions while you tour the home.