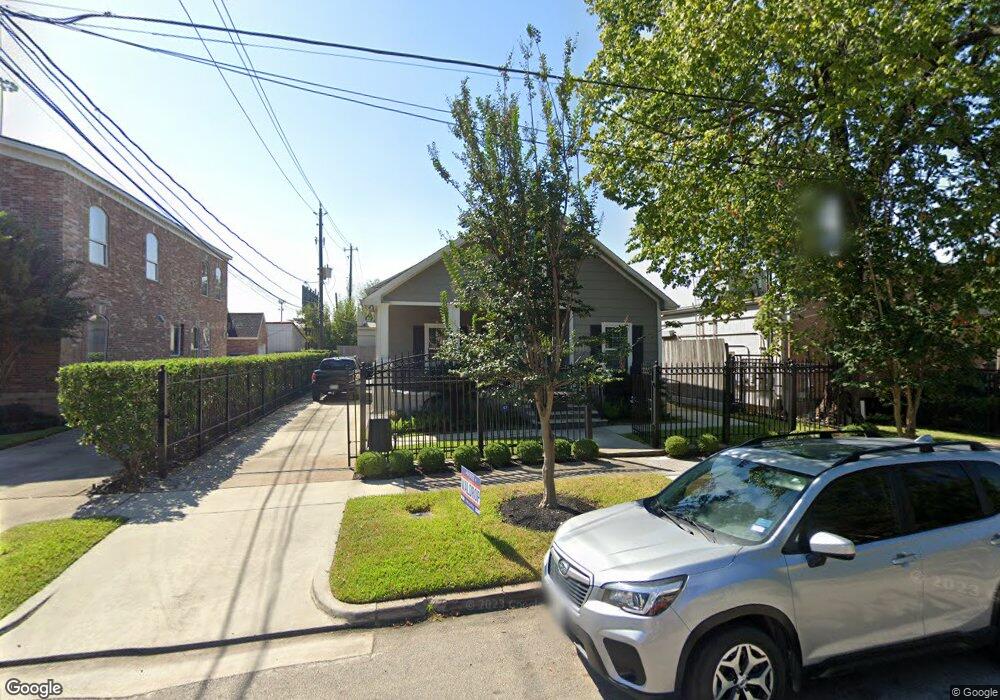
110 E 4th St Houston, TX 77007
Greater Heights NeighborhoodEstimated Value: $583,347 - $988,000
3
Beds
1
Bath
1,480
Sq Ft
$530/Sq Ft
Est. Value
About This Home
This home is located at 110 E 4th St, Houston, TX 77007 and is currently estimated at $784,087, approximately $529 per square foot. 110 E 4th St is a home located in Harris County with nearby schools including Harvard Elementary School, Hogg Middle, and Heights High School.
Ownership History
Date
Name
Owned For
Owner Type
Purchase Details
Closed on
Jul 31, 2012
Sold by
Morales Bruno and Morales Amparo
Bought by
Baba Akram Masad and Baba Violet Kawaja
Current Estimated Value
Home Financials for this Owner
Home Financials are based on the most recent Mortgage that was taken out on this home.
Original Mortgage
$185,600
Outstanding Balance
$128,635
Interest Rate
3.68%
Mortgage Type
New Conventional
Estimated Equity
$655,452
Purchase Details
Closed on
Aug 22, 2011
Sold by
Morales Daniel and Morales Bruno
Bought by
Morales Bruno and Morales Amparo
Home Financials for this Owner
Home Financials are based on the most recent Mortgage that was taken out on this home.
Original Mortgage
$418,500
Interest Rate
4.54%
Mortgage Type
Reverse Mortgage Home Equity Conversion Mortgage
Purchase Details
Closed on
Nov 13, 1997
Sold by
Morales Bruno and Morales Amparo
Bought by
Morales Daniel
Create a Home Valuation Report for This Property
The Home Valuation Report is an in-depth analysis detailing your home's value as well as a comparison with similar homes in the area
Home Values in the Area
Average Home Value in this Area
Purchase History
| Date | Buyer | Sale Price | Title Company |
|---|---|---|---|
| Baba Akram Masad | -- | None Available | |
| Morales Bruno | -- | None Available | |
| Morales Bruno | -- | None Available | |
| Morales Daniel | -- | -- |
Source: Public Records
Mortgage History
| Date | Status | Borrower | Loan Amount |
|---|---|---|---|
| Open | Morales Bruno | $185,600 | |
| Closed | Baba Akram Masad | $185,600 | |
| Previous Owner | Morales Bruno | $418,500 | |
| Closed | Morales Daniel | $0 |
Source: Public Records
Tax History
| Year | Tax Paid | Tax Assessment Tax Assessment Total Assessment is a certain percentage of the fair market value that is determined by local assessors to be the total taxable value of land and additions on the property. | Land | Improvement |
|---|---|---|---|---|
| 2025 | $12,470 | $595,316 | $400,000 | $195,316 |
| 2024 | $12,470 | $595,987 | $400,000 | $195,987 |
| 2023 | $12,470 | $591,349 | $400,000 | $191,349 |
| 2022 | $10,796 | $490,292 | $325,000 | $165,292 |
| 2021 | $10,424 | $447,250 | $325,000 | $122,250 |
| 2020 | $10,619 | $438,503 | $325,000 | $113,503 |
| 2019 | $11,299 | $446,538 | $325,000 | $121,538 |
| 2018 | $11,682 | $461,643 | $350,000 | $111,643 |
| 2017 | $11,614 | $459,312 | $350,000 | $109,312 |
| 2016 | $9,592 | $379,340 | $300,000 | $79,340 |
| 2015 | $10,237 | $363,148 | $250,000 | $113,148 |
| 2014 | $10,237 | $398,224 | $297,600 | $100,624 |
Source: Public Records
Map
Nearby Homes
- 335 Harvard St
- 122 E 4th St
- 344 Harvard St
- 254 E 5th St
- 415 Arlington St
- 517 Harvard St
- 316 E 5th St
- 432 Arlington St
- 403 Columbia St
- 402 Columbia St
- 406 Columbia St
- 516 Arlington St
- 1437 Wagner St
- 1834 Bonner St
- 1427 Wagner St
- 4111 Kolb St
- 537 Columbia St
- 4102 Marina St
- 1607 E Bonner St
- 1403 Wichman St
- 112 E 4
- 112 E 4th St
- 3600 Katy Fwy
- 402 Heights Blvd
- 113 E 4th St
- 117 E 4th St
- 121 E 4th St
- 404 Heights Blvd
- 409 Harvard St
- 416 Heights Blvd
- 411 Harvard St
- 330 Harvard St
- 210 E 4th St
- 402 Harvard St
- 420 Heights Blvd
- 333 Heights Blvd
- 325 Heights Blvd
- 325 Heights Blvd Unit C
- 321 Heights Blvd
- 408 Harvard St
Your Personal Tour Guide
Ask me questions while you tour the home.