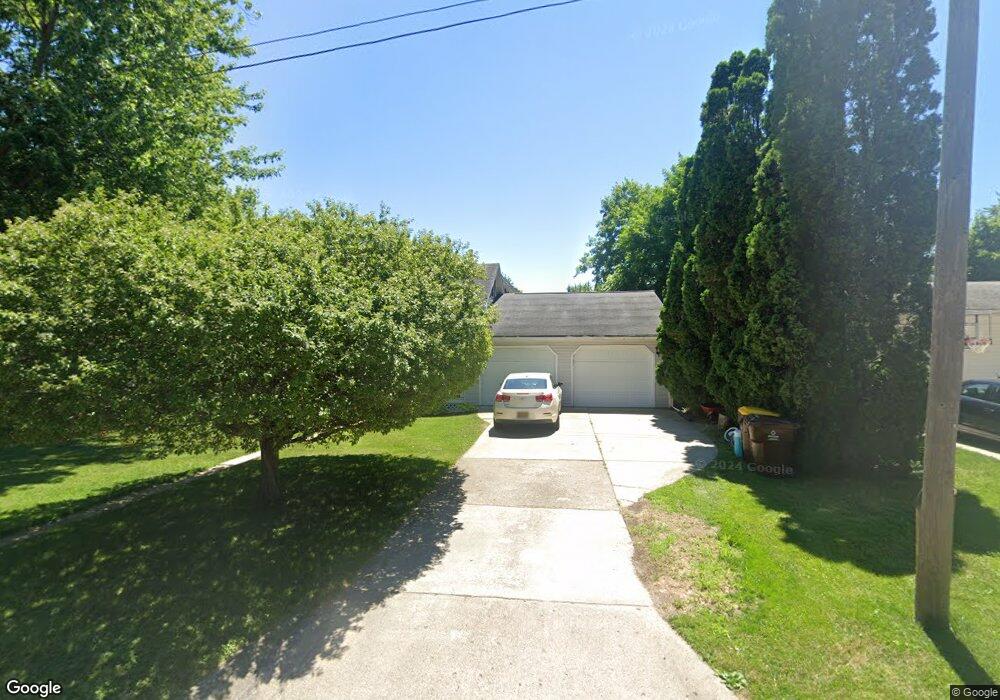
110 E Buchanan St Saint Johns, MI 48879
Estimated Value: $192,000 - $222,790
3
Beds
2
Baths
1,405
Sq Ft
$148/Sq Ft
Est. Value
About This Home
This home is located at 110 E Buchanan St, Saint Johns, MI 48879 and is currently estimated at $208,448, approximately $148 per square foot. 110 E Buchanan St is a home located in Clinton County with nearby schools including St. Johns High School and St Joseph Catholic School.
Ownership History
Date
Name
Owned For
Owner Type
Purchase Details
Closed on
Jan 11, 2019
Sold by
Simpson Jeffery V
Bought by
Simpson Kaile M
Current Estimated Value
Purchase Details
Closed on
Jul 21, 2010
Sold by
Keilen Michael W and Keilen Cynthia A
Bought by
Simpson Jeffery
Home Financials for this Owner
Home Financials are based on the most recent Mortgage that was taken out on this home.
Original Mortgage
$112,188
Outstanding Balance
$74,662
Interest Rate
4.75%
Mortgage Type
FHA
Estimated Equity
$133,786
Create a Home Valuation Report for This Property
The Home Valuation Report is an in-depth analysis detailing your home's value as well as a comparison with similar homes in the area
Home Values in the Area
Average Home Value in this Area
Purchase History
| Date | Buyer | Sale Price | Title Company |
|---|---|---|---|
| Simpson Kaile M | -- | None Available | |
| Simpson Jeffery | $113,700 | Diversified National Title |
Source: Public Records
Mortgage History
| Date | Status | Borrower | Loan Amount |
|---|---|---|---|
| Open | Simpson Jeffery | $112,188 |
Source: Public Records
Tax History
| Year | Tax Paid | Tax Assessment Tax Assessment Total Assessment is a certain percentage of the fair market value that is determined by local assessors to be the total taxable value of land and additions on the property. | Land | Improvement |
|---|---|---|---|---|
| 2025 | $2,740 | $102,200 | $13,900 | $88,300 |
| 2024 | $2,467 | $95,100 | $13,900 | $81,200 |
| 2023 | $1,785 | $89,400 | $0 | $0 |
| 2022 | $2,467 | $82,000 | $12,200 | $69,800 |
| 2021 | $2,405 | $76,200 | $10,500 | $65,700 |
| 2020 | $2,322 | $73,300 | $9,600 | $63,700 |
| 2019 | $2,252 | $69,000 | $9,600 | $59,400 |
| 2018 | $2,101 | $63,900 | $9,600 | $54,300 |
| 2017 | -- | $61,600 | $9,600 | $52,000 |
| 2016 | -- | $64,100 | $10,600 | $53,500 |
| 2015 | -- | $51,600 | $0 | $0 |
| 2011 | -- | $56,500 | $0 | $0 |
Source: Public Records
Map
Nearby Homes
- 310 E Sturgis St
- 806 S Church St
- 701 S Swegles St
- 210 Hurd St
- 1455 W Hyde Rd
- 1004 Lincolnshire Dr
- 1005 S Swegles St
- 106 W Oak St
- 100 N Oakland St
- 300 N Kibbee St
- 308 N Swegles St
- 606 E Railroad St
- 1197 Sunview Dr Unit 14
- 1275 Fieldstone Dr
- 715 N Clinton Ave
- 705 N Us127
- 719 N Clinton Ave
- 905 W Gibbs St Unit 13
- 905 W Gibbs St Unit 28
- 823 N Lansing St
- 108 E Buchanan St
- 604 S Wight St
- 200 E Buchanan St
- 510 S Wight St
- 608 S Wight St
- 601 S Clinton Ave
- 603 S Clinton Ave
- 202 E Buchanan St
- 605 S Clinton Ave
- 610 S Wight St
- 201 E Clark St
- 508 S Wight St
- 511 S Clinton Ave
- 203 E Buchanan St
- 609 S Clinton Ave
- 509 S Clinton Ave St
- 509 S Clinton Ave
- 203 E Clark St
- 0 Wight St
- 504 S Wight St
Your Personal Tour Guide
Ask me questions while you tour the home.