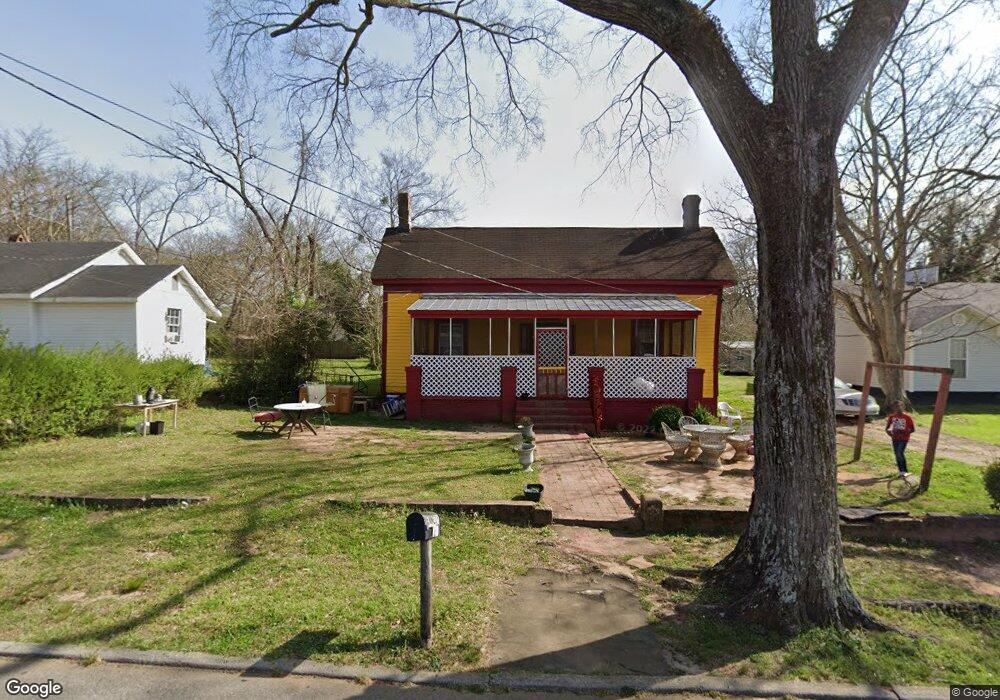
110 E Cannon St Lagrange, GA 30241
Estimated Value: $80,539 - $125,000
3
Beds
1
Bath
1,182
Sq Ft
$86/Sq Ft
Est. Value
About This Home
This home is located at 110 E Cannon St, Lagrange, GA 30241 and is currently estimated at $101,385, approximately $85 per square foot. 110 E Cannon St is a home located in Troup County with nearby schools including Callaway Elementary School, Hogansville Elementary School, and Callaway Middle School.
Ownership History
Date
Name
Owned For
Owner Type
Purchase Details
Closed on
Feb 18, 2025
Sold by
Lagrange City
Bought by
Kennedy Sarah
Current Estimated Value
Purchase Details
Closed on
Mar 20, 2024
Sold by
Kennedy Gertrude
Bought by
Kennedy Sarah
Purchase Details
Closed on
Feb 9, 2002
Sold by
Kaynee Kennedy
Bought by
Kennedy Gertrude
Purchase Details
Closed on
Feb 8, 2002
Sold by
Nathaniel Newton
Bought by
Kaynee Kennedy
Purchase Details
Closed on
Feb 5, 1991
Sold by
Charlie Kennedy
Bought by
Nathaniel Newton
Purchase Details
Closed on
Dec 10, 1979
Sold by
Wyatt L M
Bought by
Charlie Kennedy
Purchase Details
Closed on
Jan 1, 1974
Sold by
Johnnie S Williams
Bought by
Wyatt L M
Purchase Details
Closed on
Dec 1, 1973
Sold by
May Williams
Bought by
Johnnie S Williams
Purchase Details
Closed on
Jan 1, 1973
Sold by
Johnnie Williams
Bought by
May Williams
Purchase Details
Closed on
Jan 1, 1968
Sold by
Mack M Bruce
Bought by
Johnnie Williams
Create a Home Valuation Report for This Property
The Home Valuation Report is an in-depth analysis detailing your home's value as well as a comparison with similar homes in the area
Purchase History
| Date | Buyer | Sale Price | Title Company |
|---|---|---|---|
| Kennedy Sarah | -- | -- | |
| Kennedy Sarah | -- | -- | |
| Kennedy Gertrude | -- | -- | |
| Kaynee Kennedy | -- | -- | |
| Nathaniel Newton | -- | -- | |
| Charlie Kennedy | -- | -- | |
| Wyatt L M | -- | -- | |
| Johnnie S Williams | -- | -- | |
| May Williams | -- | -- | |
| Johnnie Williams | -- | -- |
Source: Public Records
Tax History
| Year | Tax Paid | Tax Assessment Tax Assessment Total Assessment is a certain percentage of the fair market value that is determined by local assessors to be the total taxable value of land and additions on the property. | Land | Improvement |
|---|---|---|---|---|
| 2025 | $781 | $28,640 | $4,480 | $24,160 |
| 2024 | $709 | $26,000 | $4,480 | $21,520 |
| 2023 | $592 | $21,720 | $4,480 | $17,240 |
| 2022 | $399 | $14,280 | $4,480 | $9,800 |
| 2021 | $39 | $13,400 | $2,680 | $10,720 |
| 2020 | $104 | $13,400 | $2,680 | $10,720 |
| 2019 | $84 | $12,760 | $2,680 | $10,080 |
| 2018 | $84 | $12,760 | $2,680 | $10,080 |
| 2017 | $84 | $12,760 | $2,680 | $10,080 |
| 2016 | $84 | $12,734 | $2,700 | $10,034 |
| 2015 | $85 | $12,734 | $2,700 | $10,034 |
| 2014 | $68 | $12,206 | $2,700 | $9,506 |
| 2013 | -- | $12,850 | $2,700 | $10,150 |
Source: Public Records
Map
Nearby Homes
- 303 E Mulberry St
- 501 Milam St
- 109 Bell St
- 203 Fannin St
- 103 Cedar St
- 101 Cedar St
- 0 E Fendig St
- 113 E Fendig St
- 112 Cedar St
- 901 Whiteline St
- 0 Boggs St Unit 10550243
- 0 Boggs St Unit 10550231
- 0 Boggs St Unit 10550239
- 0 Boggs St Unit 10550250
- 0 Bagley St
- 304 Butler St
- 200 Mccall St
- 0 Brown St Unit 10550761
- 0 Brown St Unit 10550754
- 1191 Whitesville St
- 112 E Cannon St
- 108 E Cannon St
- 113 Wright St
- 114 E Cannon St
- 111 Wright St
- 117 Wright St
- 109 Wright St
- 119 Wright St
- 107 Wright St
- 116 E Cannon St
- 105 Wright St
- 116 Wright St
- 118 Wright St
- 120 Wright St
- 106 Wright St
- 505 Whitesville St
- 501 Whitesville St
- 104 Wright St
- 409 Whitesville St
- 102 Wright St
Your Personal Tour Guide
Ask me questions while you tour the home.