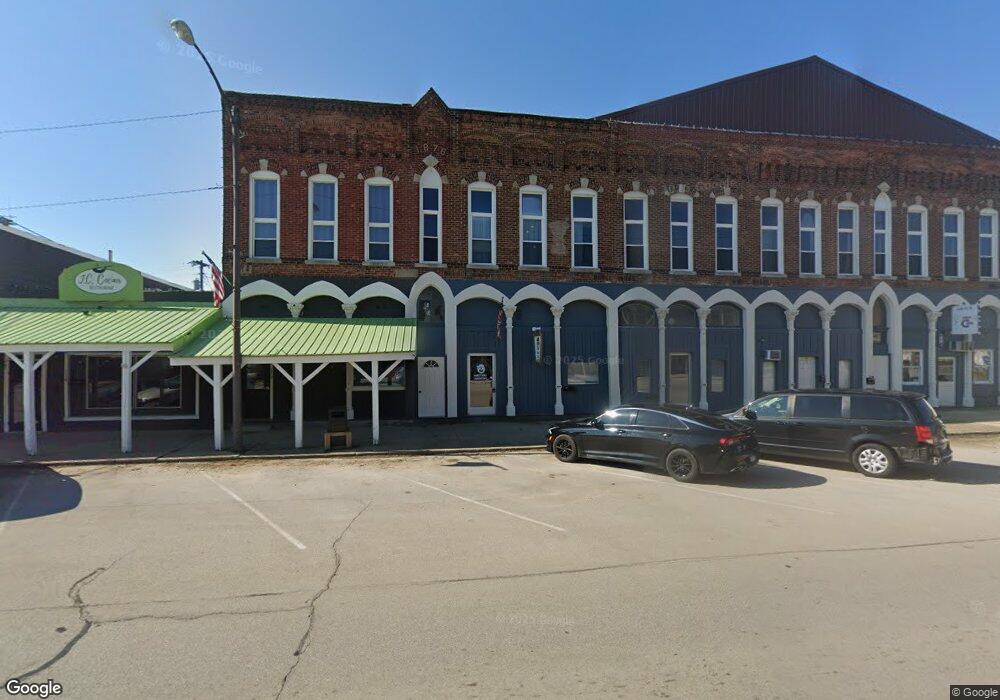
110 E Main St Thorntown, IN 46071
Estimated Value: $505,102
Studio
--
Bath
14,025
Sq Ft
$36/Sq Ft
Est. Value
About This Home
This home is located at 110 E Main St, Thorntown, IN 46071 and is currently estimated at $505,102, approximately $36 per square foot. 110 E Main St is a home located in Boone County with nearby schools including Western Boone Junior/Senior High School.
Ownership History
Date
Name
Owned For
Owner Type
Purchase Details
Closed on
Mar 13, 2020
Sold by
Ream Chris A
Bought by
Provident Real Estate Llc
Current Estimated Value
Home Financials for this Owner
Home Financials are based on the most recent Mortgage that was taken out on this home.
Original Mortgage
$260,000
Outstanding Balance
$229,771
Interest Rate
3.5%
Mortgage Type
Commercial
Estimated Equity
$275,331
Create a Home Valuation Report for This Property
The Home Valuation Report is an in-depth analysis detailing your home's value as well as a comparison with similar homes in the area
Purchase History
| Date | Buyer | Sale Price | Title Company |
|---|---|---|---|
| Provident Real Estate Llc | -- | None Available |
Source: Public Records
Mortgage History
| Date | Status | Borrower | Loan Amount |
|---|---|---|---|
| Open | Provident Real Estate Llc | $260,000 |
Source: Public Records
Tax History
| Year | Tax Paid | Tax Assessment Tax Assessment Total Assessment is a certain percentage of the fair market value that is determined by local assessors to be the total taxable value of land and additions on the property. | Land | Improvement |
|---|---|---|---|---|
| 2025 | $5,132 | $317,800 | $17,800 | $300,000 |
| 2024 | $5,132 | $308,500 | $17,800 | $290,700 |
| 2023 | $5,420 | $308,500 | $17,800 | $290,700 |
| 2022 | $5,475 | $308,500 | $17,800 | $290,700 |
| 2021 | $5,745 | $299,500 | $17,800 | $281,700 |
| 2020 | $2,304 | $118,100 | $17,800 | $100,300 |
| 2019 | $2,264 | $118,100 | $17,800 | $100,300 |
| 2018 | $2,242 | $118,100 | $17,800 | $100,300 |
| 2017 | $2,125 | $114,100 | $17,800 | $96,300 |
| 2016 | $2,034 | $114,100 | $17,800 | $96,300 |
| 2014 | $2,014 | $114,500 | $17,800 | $96,700 |
| 2013 | $2,148 | $114,500 | $17,800 | $96,700 |
Source: Public Records
Map
Nearby Homes
- 307 S Market St
- 315 S Market St
- 222 N Front St
- 6433 W State Road 47
- 5984 Stoney Brook Ln
- 8257 Strong Way
- 6042 Whitney St
- 6139 Westfall Dr
- 5593 W 700 N
- 5571 W 700 N
- 8200 N US Highway 52
- 6690 W Hazelrigg Rd
- 5158 N 1000 W
- 7001 N 1075 W
- 5388 W Hazelrigg Rd
- 6519 N 350 W
- 4535 N Us Hwy 52
- 3502 W 450 N
- 3901 N 350 W
- 5675 W 200 N
- 110 E Main St
- 108 W Main St Unit A
- 108 W Main St Unit B
- 109 S Market St
- 111 S Market St
- 106 E Main St Unit 106 e main
- 120 E Main St
- 104 W Main St Unit B
- 104 W Main St Unit A
- 104 W Main St Unit 2B
- 104 W Main St Unit 104 2B
- 104 W Main St Unit 104 2C
- 106 S Market St
- 111 E Main St Unit B
- 101 E Main St
- 113 E Main St Unit B
- 113 E Main St
- 117 S Market St
- 108 S Market St
- 108 S Market St Unit 1
Your Personal Tour Guide
Ask me questions while you tour the home.