
Seller's Agent in 2020
Katie Golliday
Keller Williams Revolution
(815) 674-0845
66 Total Sales


Estimated Value: $152,000 - $195,000
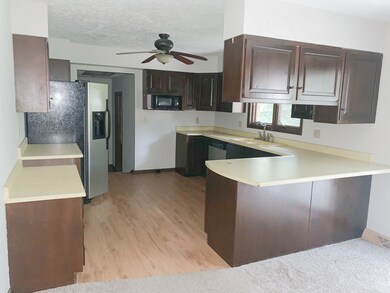
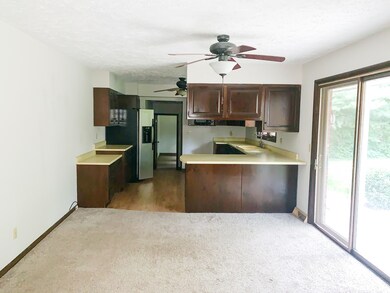
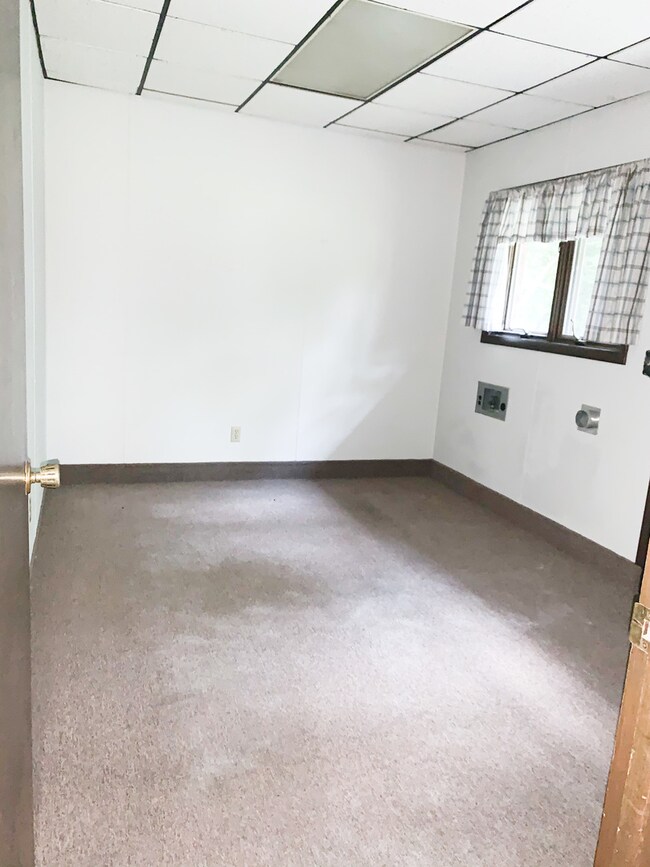
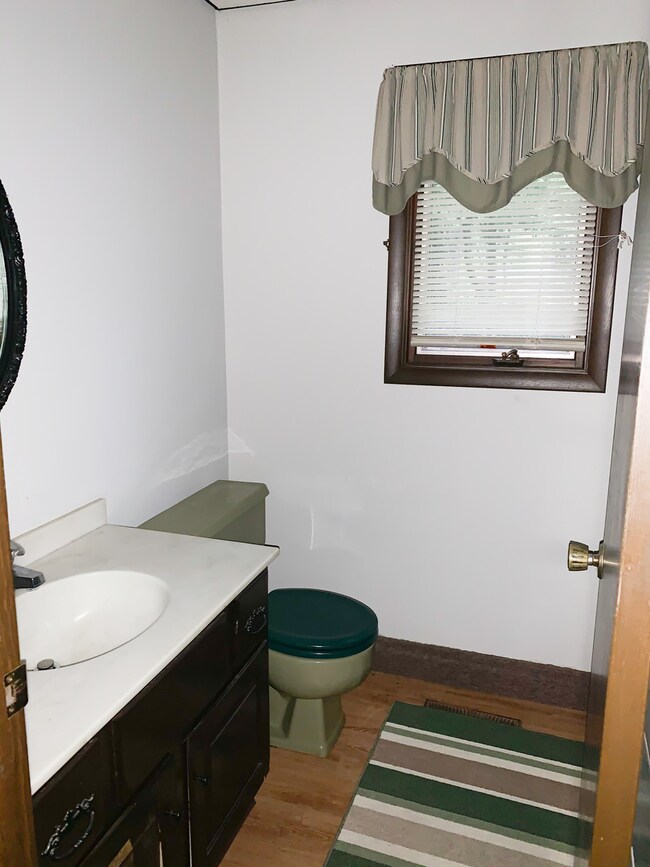
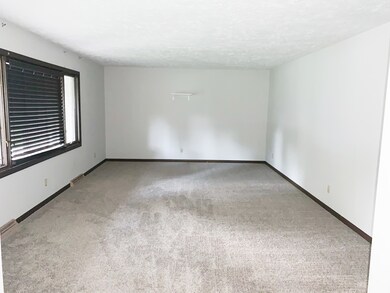
Check out this move in ready house with a private backyard and walking distance to the park! Brand new flooring, updated bathroom. Enjoy sitting on the front porch with extra large overhang or enjoy the peace of the private backyard! 2 car attached garage!
Last Agent to Sell the Property
Keller Williams Revolution License #475156002 Listed on: 09/21/2020
Last Buyer's Agent
Keller Williams Revolution License #475156002 Listed on: 09/21/2020
| Date | Buyer | Sale Price | Title Company |
|---|---|---|---|
| Gutwein Caleb N | $125,000 | None Available |
| Date | Status | Borrower | Loan Amount |
|---|---|---|---|
| Open | Gutwein Caleb N | $200,000 |
| Date | Event | Price | List to Sale | Price per Sq Ft |
|---|---|---|---|---|
| 11/04/2020 11/04/20 | Sold | $124,900 | 0.0% | $91 / Sq Ft |
| 10/05/2020 10/05/20 | Pending | -- | -- | -- |
| 09/21/2020 09/21/20 | For Sale | $124,900 | -- | $91 / Sq Ft |
| Year | Tax Paid | Tax Assessment Tax Assessment Total Assessment is a certain percentage of the fair market value that is determined by local assessors to be the total taxable value of land and additions on the property. | Land | Improvement |
|---|---|---|---|---|
| 2024 | $4,316 | $57,912 | $2,299 | $55,613 |
| 2023 | $4,229 | $50,800 | $2,017 | $48,783 |
| 2022 | $3,582 | $42,689 | $2,017 | $40,672 |
| 2021 | $3,409 | $40,122 | $1,896 | $38,226 |
| 2020 | $3,976 | $39,548 | $1,896 | $37,652 |
| 2019 | $4,064 | $40,771 | $1,955 | $38,816 |
| 2018 | $4,031 | $39,827 | $1,880 | $37,947 |
| 2017 | $3,850 | $37,930 | $1,790 | $36,140 |
| 2016 | $3,881 | $37,930 | $1,790 | $36,140 |
| 2015 | $3,992 | $39,511 | $1,865 | $37,646 |
| 2013 | $4,242 | $40,949 | $1,984 | $38,965 |
Seller's Agent in 2020
Katie Golliday
Keller Williams Revolution
(815) 674-0845
66 Total Sales
Source: Midwest Real Estate Data (MRED)
MLS Number: MRD10846515
APN: 26-26-10-101-016
Disclaimer: Certain information contained herein is derived from information provided by parties other than Homes.com. All information provided is deemed reliable, but is not guaranteed to be accurate and should be independently verified.
![]() Based on information submitted to the MLS GRID. All data is obtained from various sources and may not have been verified by broker or MLS GRID. Supplied Open House Information is subject to change without notice. All information should be independently reviewed and verified for accuracy. Properties may or may not be listed by the office/agent presenting the information. Some IDX listings have been excluded from this website.
Based on information submitted to the MLS GRID. All data is obtained from various sources and may not have been verified by broker or MLS GRID. Supplied Open House Information is subject to change without notice. All information should be independently reviewed and verified for accuracy. Properties may or may not be listed by the office/agent presenting the information. Some IDX listings have been excluded from this website.
Based on information submitted to the MLS GRID
Ask me questions while you tour the home.