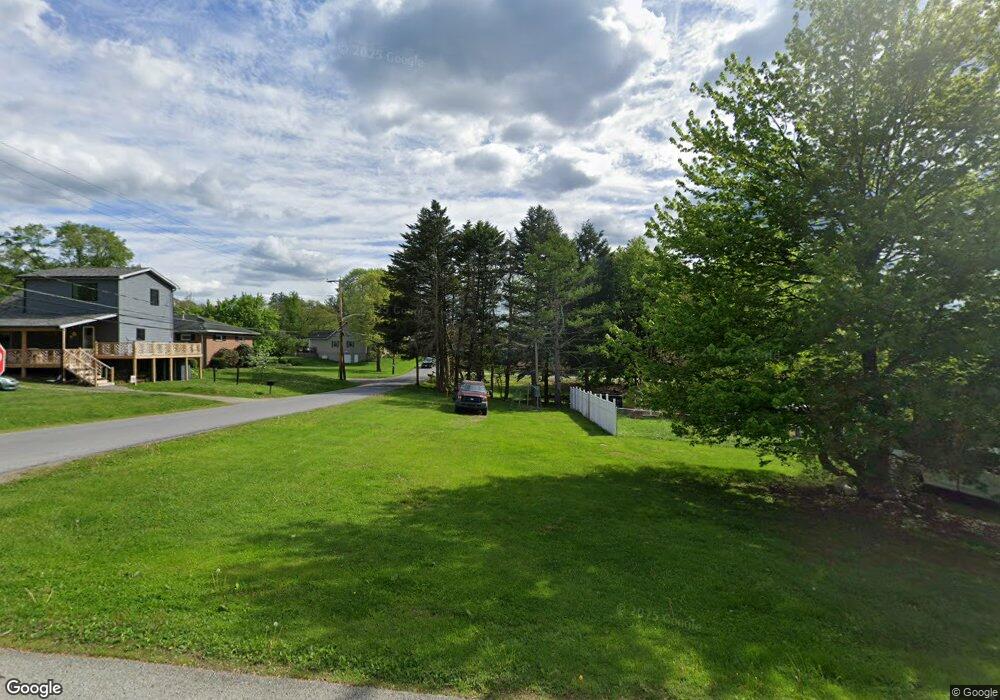
110 E Tennyson St Homer City, PA 15748
Estimated Value: $180,000 - $286,000
3
Beds
1
Bath
1,008
Sq Ft
$209/Sq Ft
Est. Value
About This Home
This home is located at 110 E Tennyson St, Homer City, PA 15748 and is currently estimated at $210,698, approximately $209 per square foot. 110 E Tennyson St is a home located in Indiana County with nearby schools including Homer-Center Elementary School and Homer-Center Junior/Senior High School.
Ownership History
Date
Name
Owned For
Owner Type
Purchase Details
Closed on
Jun 17, 2015
Sold by
Wendel Travis M and Wendel Leslie
Bought by
Hutton Forrest M and Cowfer Brittany N
Current Estimated Value
Home Financials for this Owner
Home Financials are based on the most recent Mortgage that was taken out on this home.
Original Mortgage
$121,655
Outstanding Balance
$93,377
Interest Rate
3.5%
Mortgage Type
FHA
Estimated Equity
$117,321
Purchase Details
Closed on
Sep 12, 2011
Sold by
Quarles Christian and Shirley Donna M
Bought by
Wendel Travis M
Home Financials for this Owner
Home Financials are based on the most recent Mortgage that was taken out on this home.
Original Mortgage
$113,989
Interest Rate
4.15%
Mortgage Type
New Conventional
Create a Home Valuation Report for This Property
The Home Valuation Report is an in-depth analysis detailing your home's value as well as a comparison with similar homes in the area
Home Values in the Area
Average Home Value in this Area
Purchase History
| Date | Buyer | Sale Price | Title Company |
|---|---|---|---|
| Hutton Forrest M | $123,900 | None Available | |
| Wendel Travis M | $110,000 | None Available |
Source: Public Records
Mortgage History
| Date | Status | Borrower | Loan Amount |
|---|---|---|---|
| Open | Hutton Forrest M | $121,655 | |
| Previous Owner | Wendel Travis M | $113,989 |
Source: Public Records
Tax History Compared to Growth
Tax History
| Year | Tax Paid | Tax Assessment Tax Assessment Total Assessment is a certain percentage of the fair market value that is determined by local assessors to be the total taxable value of land and additions on the property. | Land | Improvement |
|---|---|---|---|---|
| 2025 | $3,400 | $123,800 | $11,100 | $112,700 |
| 2024 | $3,227 | $123,800 | $11,100 | $112,700 |
| 2023 | $3,135 | $123,800 | $11,100 | $112,700 |
| 2022 | $3,151 | $123,800 | $11,100 | $112,700 |
| 2021 | $3,151 | $123,800 | $11,100 | $112,700 |
| 2020 | $3,094 | $123,800 | $11,100 | $112,700 |
| 2018 | $3,037 | $123,800 | $11,100 | $112,700 |
| 2017 | $3,037 | $123,800 | $11,100 | $112,700 |
| 2016 | -- | $123,800 | $11,100 | $112,700 |
| 2015 | -- | $16,770 | $1,670 | $15,100 |
| 2014 | -- | $16,770 | $1,670 | $15,100 |
Source: Public Records
Map
Nearby Homes