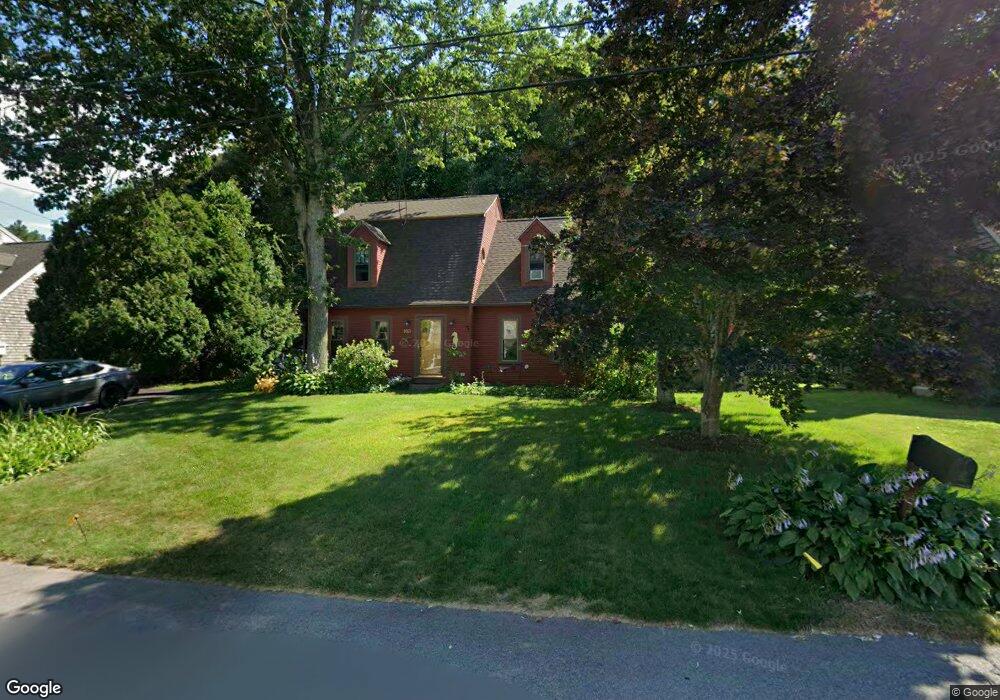
110 Edwards Rd Marshfield, MA 02050
Green Harbor-Cedar Crest NeighborhoodEstimated Value: $694,205 - $747,000
3
Beds
2
Baths
1,702
Sq Ft
$423/Sq Ft
Est. Value
About This Home
This home is located at 110 Edwards Rd, Marshfield, MA 02050 and is currently estimated at $719,551, approximately $422 per square foot. 110 Edwards Rd is a home located in Plymouth County with nearby schools including Governor Edward Winslow School, Furnace Brook Middle School, and Marshfield High School.
Ownership History
Date
Name
Owned For
Owner Type
Purchase Details
Closed on
Nov 19, 2004
Sold by
Grossman Gabrielle M and Grossman Daniel J
Bought by
Kenneflick Denis E and Wiles Verna E
Current Estimated Value
Home Financials for this Owner
Home Financials are based on the most recent Mortgage that was taken out on this home.
Original Mortgage
$117,250
Outstanding Balance
$56,959
Interest Rate
5.8%
Mortgage Type
Purchase Money Mortgage
Estimated Equity
$662,592
Purchase Details
Closed on
Apr 1, 2003
Sold by
Baggs Edward P and Baggs Cheryl A
Bought by
Smith Gabriele M
Purchase Details
Closed on
Oct 31, 2002
Sold by
Baggs Edward P and Baggs Cheryl
Bought by
Smith Gabrielle M and Grossman Daniel J
Purchase Details
Closed on
Nov 7, 1991
Sold by
Mccue Donna L
Bought by
Baggs Edward P and Baggs Cheryl A
Purchase Details
Closed on
Aug 1, 1988
Sold by
Ladd Mary R
Bought by
Mccue Edward L
Create a Home Valuation Report for This Property
The Home Valuation Report is an in-depth analysis detailing your home's value as well as a comparison with similar homes in the area
Home Values in the Area
Average Home Value in this Area
Purchase History
| Date | Buyer | Sale Price | Title Company |
|---|---|---|---|
| Kenneflick Denis E | $377,250 | -- | |
| Kenneflick Denis E | $377,250 | -- | |
| Smith Gabriele M | $329,000 | -- | |
| Smith Gabriele M | $329,000 | -- | |
| Smith Gabrielle M | $329,000 | -- | |
| Smith Gabrielle M | $329,000 | -- | |
| Baggs Edward P | $135,000 | -- | |
| Mccue Edward L | $153,000 | -- |
Source: Public Records
Mortgage History
| Date | Status | Borrower | Loan Amount |
|---|---|---|---|
| Open | Mccue Edward L | $14,000 | |
| Open | Mccue Edward L | $117,250 |
Source: Public Records
Tax History
| Year | Tax Paid | Tax Assessment Tax Assessment Total Assessment is a certain percentage of the fair market value that is determined by local assessors to be the total taxable value of land and additions on the property. | Land | Improvement |
|---|---|---|---|---|
| 2025 | $5,399 | $545,400 | $259,700 | $285,700 |
| 2024 | $5,298 | $509,900 | $249,700 | $260,200 |
| 2023 | $5,076 | $455,400 | $229,700 | $225,700 |
| 2022 | $5,076 | $392,000 | $199,800 | $192,200 |
| 2021 | $4,919 | $372,900 | $199,800 | $173,100 |
| 2020 | $4,775 | $358,200 | $189,800 | $168,400 |
| 2019 | $4,666 | $348,700 | $189,800 | $158,900 |
| 2018 | $4,619 | $345,500 | $189,800 | $155,700 |
| 2017 | $4,227 | $308,100 | $179,800 | $128,300 |
| 2016 | $4,195 | $302,200 | $179,800 | $122,400 |
| 2015 | $4,016 | $302,200 | $179,800 | $122,400 |
| 2014 | $3,952 | $297,400 | $179,800 | $117,600 |
Source: Public Records
Map
Nearby Homes
- 106 Careswell St
- 71 Gurnet Rd
- 116 Island St
- 122 June St
- 78 Tower Ave
- 17 Dyke Rd
- 116 Outlook Rd
- 86 Barouche Dr
- 19 2nd Rd
- 32 Gratto Rd
- 387 Lot 2A Old Cove Rd
- 387 Lot 3A Old Cove Rd
- 387 Lot 4A Old Cove Rd
- 236 Powder Point Ave
- 42 Carr Rd
- 30 Chandler Dr
- 242 Enterprise St
- 713 Webster St
- 184 King Phillips Pathe
- 431 Moraine St
- 110 Edward Rd
- 106 Edwards Rd
- 106 Edward Rd
- 118 Edwards Rd
- 102 Edwards Rd
- 122 Edwards Rd
- 111 Edwards Rd
- 107 Edwards Rd
- 103 Edwards Rd
- 2 Missouri St
- 99 Edward Rd
- 33 Blue Heron Way
- 94 Edwards Rd
- 41 Blue Heron Way
- 99 Edwards Rd
- 27 Blue Heron Way
- 155 Canal St
- 10 Missouri St
- 47 Blue Heron Way
- 86 Temple Rd