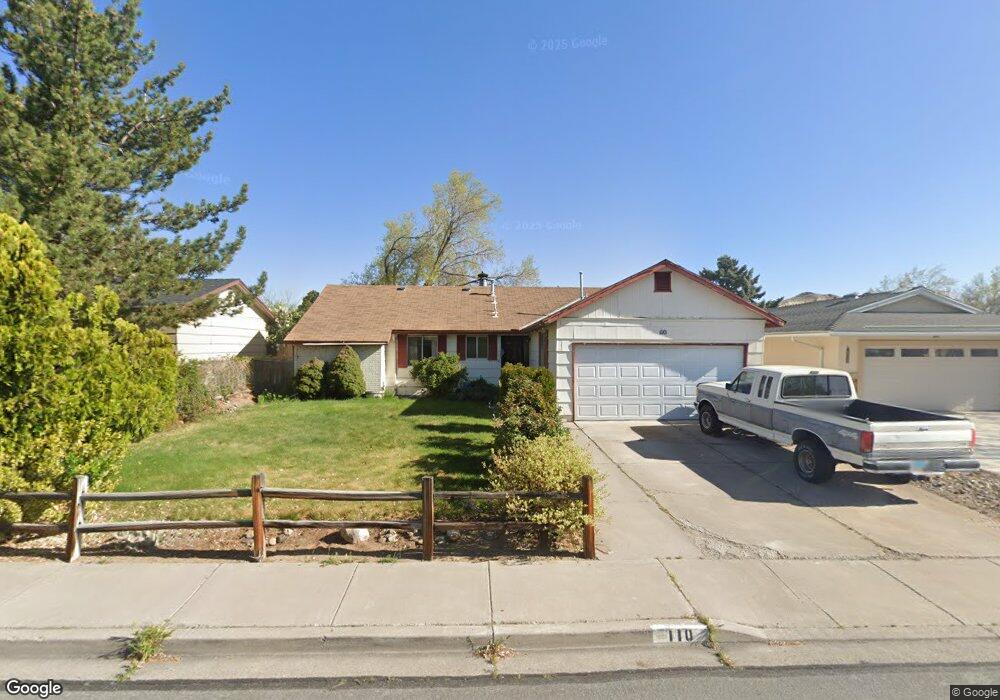
110 Emerson Way Sparks, NV 89431
McCarran Boulevard-Probasco NeighborhoodEstimated Value: $410,000 - $439,000
3
Beds
2
Baths
1,287
Sq Ft
$330/Sq Ft
Est. Value
About This Home
This home is located at 110 Emerson Way, Sparks, NV 89431 and is currently estimated at $425,253, approximately $330 per square foot. 110 Emerson Way is a home located in Washoe County with nearby schools including Hershal H. Beam Elementary School, Lena Juniper Elementary School, and Lou Mendive Middle School.
Ownership History
Date
Name
Owned For
Owner Type
Purchase Details
Closed on
May 8, 2002
Sold by
Soule Jeffrey T and Soule Mary A
Bought by
See Steven
Current Estimated Value
Home Financials for this Owner
Home Financials are based on the most recent Mortgage that was taken out on this home.
Original Mortgage
$133,119
Outstanding Balance
$57,001
Interest Rate
7.13%
Mortgage Type
FHA
Estimated Equity
$368,252
Purchase Details
Closed on
Jul 8, 1999
Sold by
Soule Tonya R
Bought by
Soule Jeffrey T
Home Financials for this Owner
Home Financials are based on the most recent Mortgage that was taken out on this home.
Original Mortgage
$124,808
Interest Rate
7.4%
Mortgage Type
FHA
Purchase Details
Closed on
Oct 26, 1994
Sold by
Tattics Gary H and Tattics Mary D
Bought by
Garcia Paul A and Garcia Bertha A
Home Financials for this Owner
Home Financials are based on the most recent Mortgage that was taken out on this home.
Original Mortgage
$113,344
Interest Rate
8.7%
Mortgage Type
FHA
Create a Home Valuation Report for This Property
The Home Valuation Report is an in-depth analysis detailing your home's value as well as a comparison with similar homes in the area
Home Values in the Area
Average Home Value in this Area
Purchase History
| Date | Buyer | Sale Price | Title Company |
|---|---|---|---|
| See Steven | $135,000 | Western Title Inc | |
| Soule Jeffrey T | -- | Stewart Title | |
| Soule Jeffrey T | $125,000 | Stewart Title | |
| Garcia Paul A | $115,000 | Western Title Company Inc |
Source: Public Records
Mortgage History
| Date | Status | Borrower | Loan Amount |
|---|---|---|---|
| Open | See Steven | $133,119 | |
| Previous Owner | Soule Jeffrey T | $124,808 | |
| Previous Owner | Garcia Paul A | $113,344 |
Source: Public Records
Tax History Compared to Growth
Tax History
| Year | Tax Paid | Tax Assessment Tax Assessment Total Assessment is a certain percentage of the fair market value that is determined by local assessors to be the total taxable value of land and additions on the property. | Land | Improvement |
|---|---|---|---|---|
| 2025 | $1,285 | $56,917 | $36,715 | $20,202 |
| 2024 | $1,285 | $54,682 | $34,755 | $19,927 |
| 2023 | $1,308 | $53,353 | $34,930 | $18,423 |
| 2022 | $1,212 | $43,434 | $28,455 | $14,979 |
| 2021 | $1,123 | $34,284 | $19,635 | $14,649 |
| 2020 | $1,055 | $33,093 | $17,850 | $15,243 |
| 2019 | $1,005 | $33,974 | $18,725 | $15,249 |
| 2018 | $960 | $28,957 | $13,545 | $15,412 |
| 2017 | $921 | $27,995 | $12,075 | $15,920 |
| 2016 | $897 | $28,161 | $11,550 | $16,611 |
| 2015 | $896 | $26,521 | $9,415 | $17,106 |
| 2014 | $868 | $24,896 | $7,980 | $16,916 |
| 2013 | -- | $23,183 | $5,985 | $17,198 |
Source: Public Records
Map
Nearby Homes
- 3245 Elaine Way
- 120 E Lenwood Dr
- 119 Devere Way
- 465 Lenwood Dr
- 3465 Dawn Cir
- 10 Sheridan Way
- 3545 4th St
- 3071 Meadowlands Dr
- 3595 Rocky Ridge Ct
- 780 Emerson Way
- 3104 Sandy St
- 3607 Keogh Dr
- 3167 Bristle Branch Dr
- 3188 Bristle Branch Dr
- 3198 Bristle Branch Dr
- 3200 Bristle Branch Dr
- 1940 4th St Unit 20
- 1940 4th St Unit 51
- 1945 4th St Unit 32
- 1945 4th St Unit 33
- 142 Emerson Way
- 102 Emerson Way
- 133 Abbay Way
- 163 Abbay Way
- 174 Emerson Way
- 101 Abbay Way
- 115 Emerson Way
- 203 Abbay Way
- 103 Emerson Way
- 149 Emerson Way
- 194 Emerson Way
- 225 Abbay Way
- 96 Emerson Way
- 177 Emerson Way
- 3280 Dana Way
- 3160 Dana Way
- 202 Emerson Way
- 110 Lenwood Dr
- 130 Abbay Way
- 102 Lenwood Dr