Estimated Value: $359,000 - $393,000
3
Beds
2
Baths
2,016
Sq Ft
$186/Sq Ft
Est. Value
About This Home
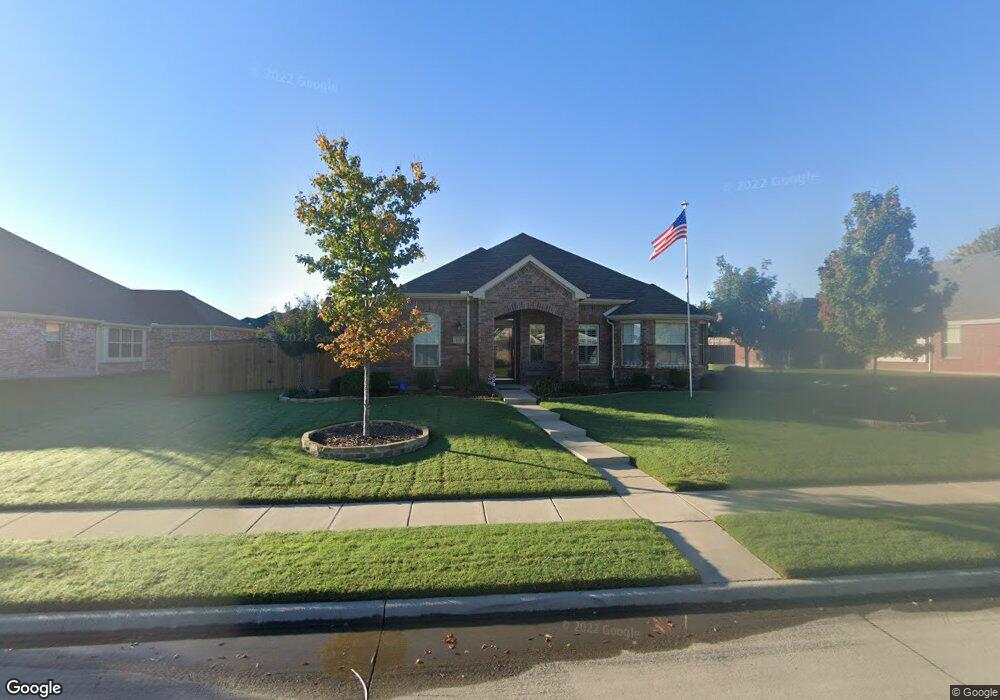
This home is located at 110 Forestbrook Dr, Wylie, TX 75098 and is currently estimated at $375,931, approximately $186 per square foot. 110 Forestbrook Dr is a home located in Collin County with nearby schools including Wally Watkins Elementary School, AB Harrison Intermediate School, and Grady Burnett J High School.
Ownership History
Date
Name
Owned For
Owner Type
Purchase Details
Closed on
Jul 22, 2011
Sold by
Onyx Homes L P
Bought by
Smith Lila
Current Estimated Value
Purchase Details
Closed on
Nov 22, 2010
Sold by
Onyx Builders L L C
Bought by
Onyx Homes L P
Home Financials for this Owner
Home Financials are based on the most recent Mortgage that was taken out on this home.
Original Mortgage
$146,781
Interest Rate
4.23%
Mortgage Type
Purchase Money Mortgage
Purchase Details
Closed on
Jul 28, 2009
Sold by
Gee James and Gee Stacy
Bought by
Onyx Builders Llc
Home Financials for this Owner
Home Financials are based on the most recent Mortgage that was taken out on this home.
Original Mortgage
$527,000
Interest Rate
5.44%
Mortgage Type
Purchase Money Mortgage
Create a Home Valuation Report for This Property
The Home Valuation Report is an in-depth analysis detailing your home's value as well as a comparison with similar homes in the area
Home Values in the Area
Average Home Value in this Area
Purchase History
| Date | Buyer | Sale Price | Title Company |
|---|---|---|---|
| Smith Lila | -- | Fatco | |
| Onyx Homes L P | -- | Fatco | |
| Onyx Builders Llc | -- | None Available |
Source: Public Records
Mortgage History
| Date | Status | Borrower | Loan Amount |
|---|---|---|---|
| Previous Owner | Onyx Homes L P | $146,781 | |
| Previous Owner | Onyx Builders Llc | $527,000 |
Source: Public Records
Tax History Compared to Growth
Tax History
| Year | Tax Paid | Tax Assessment Tax Assessment Total Assessment is a certain percentage of the fair market value that is determined by local assessors to be the total taxable value of land and additions on the property. | Land | Improvement |
|---|---|---|---|---|
| 2025 | $1,470 | $414,475 | $94,500 | $325,812 |
| 2024 | $1,470 | $376,795 | $94,500 | $300,579 |
| 2023 | $1,470 | $342,541 | $94,500 | $324,460 |
| 2022 | $6,832 | $311,401 | $84,000 | $273,274 |
| 2021 | $6,661 | $283,092 | $63,000 | $220,092 |
| 2020 | $6,961 | $280,354 | $63,000 | $217,354 |
| 2019 | $6,807 | $259,039 | $63,000 | $201,215 |
| 2018 | $6,342 | $235,490 | $57,750 | $194,603 |
| 2017 | $5,765 | $233,915 | $57,750 | $176,165 |
| 2016 | $5,408 | $203,774 | $39,900 | $163,874 |
| 2015 | $3,507 | $181,630 | $39,900 | $141,730 |
Source: Public Records
Map
Nearby Homes
- 203 Forestbrook Dr
- 226 Shadybrook Dr
- 109 Rockbrook Dr
- 1706 Asbury Dr
- 212 Colonial Dr
- 314 Lake Texoma Dr
- 103 Cascade Ln
- 1306 Angel Fire Dr
- 206 Covington Dr
- 105 Dove Haven Dr
- 217 Cloudcroft Dr
- 800 Twin Oaks Dr
- 217 Champion
- 807 Crescent Way
- Oakhaven Plan at Alanis Crossing
- Valencia Plan at Alanis Crossing
- 407 Stoneybrook Dr
- 401 Willow Way
- 100 Lavender Ln
- 123 Monarch Way
- 112 Forestbrook Dr
- 108 Forestbrook Dr
- 115 Shadybrook Dr
- 113 Shadybrook Dr
- 117 Shadybrook Dr
- 113 Forestbrook Dr
- 114 Forestbrook Dr
- 106 Forestbrook Dr
- 111 Forestbrook Dr
- 115 Forestbrook Dr
- 111 Shadybrook Dr
- 119 Shadybrook Dr
- 109 Forestbrook Dr
- 117 Forestbrook Dr
- 109 Shadybrook Dr
- 121 Shadybrook Dr
- 204 Forestbrook Dr
- 104 Forestbrook Dr
- 128 Martin Dr
- 107 Shadybrook Dr