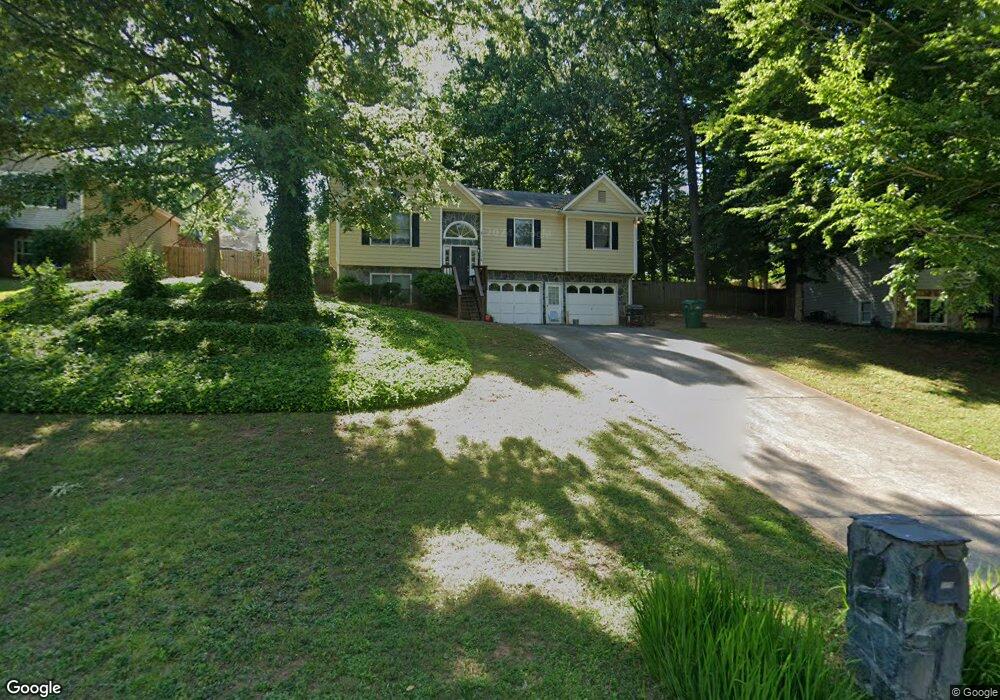
110 Franklin Hills Ct Canton, GA 30114
Estimated Value: $370,000 - $384,317
4
Beds
3
Baths
1,959
Sq Ft
$192/Sq Ft
Est. Value
About This Home
This home is located at 110 Franklin Hills Ct, Canton, GA 30114 and is currently estimated at $375,829, approximately $191 per square foot. 110 Franklin Hills Ct is a home located in Cherokee County with nearby schools including J. Knox Elementary School, Teasley Middle School, and Cherokee High School.
Ownership History
Date
Name
Owned For
Owner Type
Purchase Details
Closed on
Jul 13, 2015
Sold by
Beavers Derrell
Bought by
America Homes 4 Rent Properties Eight Ll
Current Estimated Value
Purchase Details
Closed on
Mar 30, 2010
Sold by
Federal Natl Mtg Assn Fnma
Bought by
Beavers Derrell and Beavers Bonnie
Home Financials for this Owner
Home Financials are based on the most recent Mortgage that was taken out on this home.
Original Mortgage
$95,975
Interest Rate
4.87%
Mortgage Type
FHA
Purchase Details
Closed on
Sep 1, 2009
Sold by
Citimortgage Inc
Bought by
Federal Natl Mtg Assn Fnma
Purchase Details
Closed on
Apr 21, 1995
Sold by
Etowah Homes In C
Bought by
Mclaughlin Larry Susan
Create a Home Valuation Report for This Property
The Home Valuation Report is an in-depth analysis detailing your home's value as well as a comparison with similar homes in the area
Home Values in the Area
Average Home Value in this Area
Purchase History
| Date | Buyer | Sale Price | Title Company |
|---|---|---|---|
| America Homes 4 Rent Properties Eight Ll | $135,000 | -- | |
| Beavers Derrell | $97,800 | -- | |
| Federal Natl Mtg Assn Fnma | -- | -- | |
| Citimortgage Inc | $88,817 | -- | |
| Mclaughlin Larry Susan | $90,500 | -- |
Source: Public Records
Mortgage History
| Date | Status | Borrower | Loan Amount |
|---|---|---|---|
| Previous Owner | Beavers Derrell | $95,975 | |
| Closed | Mclaughlin Larry Susan | $0 |
Source: Public Records
Tax History Compared to Growth
Tax History
| Year | Tax Paid | Tax Assessment Tax Assessment Total Assessment is a certain percentage of the fair market value that is determined by local assessors to be the total taxable value of land and additions on the property. | Land | Improvement |
|---|---|---|---|---|
| 2024 | $3,779 | $132,012 | $14,000 | $118,012 |
| 2023 | $3,596 | $125,624 | $14,000 | $111,624 |
| 2022 | $2,773 | $96,636 | $14,000 | $82,636 |
| 2021 | $2,997 | $98,288 | $14,000 | $84,288 |
| 2020 | $1,859 | $60,910 | $8,000 | $52,910 |
| 2019 | $1,860 | $60,880 | $8,000 | $52,880 |
| 2018 | $1,870 | $60,880 | $8,000 | $52,880 |
| 2017 | $1,882 | $152,200 | $8,000 | $52,880 |
| 2016 | $1,370 | $133,100 | $8,000 | $45,240 |
| 2015 | $1,209 | $116,400 | $6,000 | $40,560 |
| 2014 | $1,425 | $110,600 | $6,000 | $38,240 |
Source: Public Records
Map
Nearby Homes
- 110 Franklin Hills Ct
- 108 Franklin Hills Ct
- 112 Franklin Hills Ct
- 592 N Etowah Dr
- 114 Franklin Hills Ct
- 106 Franklin Hills Ct
- 0 Franklin Hills Ct Unit 7358745
- 0 Franklin Hills Ct Unit 7488366
- 0 Franklin Hills Ct Unit 7472190
- 0 Franklin Hills Ct Unit 8903290
- 0 Franklin Hills Ct Unit 8782081
- 0 Franklin Hills Ct Unit 8705132
- 0 Franklin Hills Ct Unit 8338408
- 0 Franklin Hills Ct Unit 8199562
- 0 Franklin Hills Ct Unit 8574339
- 0 Franklin Hills Ct Unit 8534411
- 0 Franklin Hills Ct Unit 7155887
- 0 Franklin Hills Ct
- 109 Franklin Hills Ct
- 107 Franklin Hills Ct