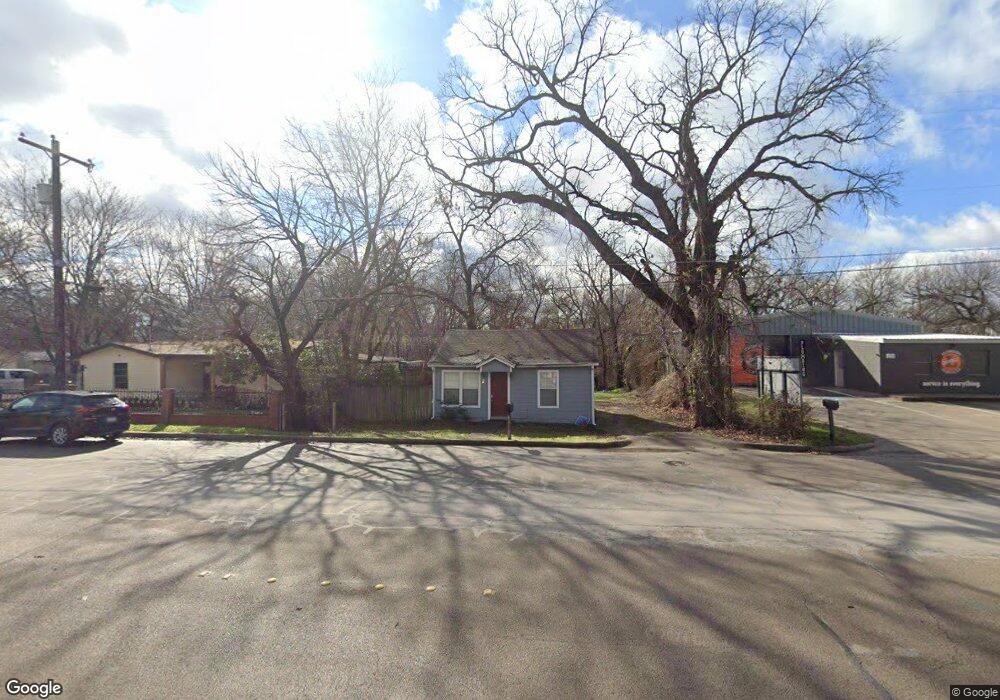
110 Front St Weatherford, TX 76086
Estimated Value: $169,000 - $240,000
2
Beds
1
Bath
768
Sq Ft
$252/Sq Ft
Est. Value
About This Home
This home is located at 110 Front St, Weatherford, TX 76086 and is currently estimated at $193,308, approximately $251 per square foot. 110 Front St is a home located in Parker County with nearby schools including Seguin Elementary School, Tison Middle School, and Weatherford High School.
Ownership History
Date
Name
Owned For
Owner Type
Purchase Details
Closed on
Mar 24, 2022
Sold by
Henderson Jennifer L
Bought by
Henderson Harley J
Current Estimated Value
Purchase Details
Closed on
Dec 10, 2007
Sold by
Trent Dixie V
Bought by
Henderson Jennifer
Home Financials for this Owner
Home Financials are based on the most recent Mortgage that was taken out on this home.
Original Mortgage
$28,600
Interest Rate
6.26%
Mortgage Type
Purchase Money Mortgage
Create a Home Valuation Report for This Property
The Home Valuation Report is an in-depth analysis detailing your home's value as well as a comparison with similar homes in the area
Home Values in the Area
Average Home Value in this Area
Purchase History
| Date | Buyer | Sale Price | Title Company |
|---|---|---|---|
| Henderson Harley J | -- | Kary L Key | |
| Henderson Jennifer | -- | Fnt |
Source: Public Records
Mortgage History
| Date | Status | Borrower | Loan Amount |
|---|---|---|---|
| Previous Owner | Henderson Jennifer | $28,600 |
Source: Public Records
Tax History Compared to Growth
Tax History
| Year | Tax Paid | Tax Assessment Tax Assessment Total Assessment is a certain percentage of the fair market value that is determined by local assessors to be the total taxable value of land and additions on the property. | Land | Improvement |
|---|---|---|---|---|
| 2025 | $2,915 | $173,740 | $50,000 | $123,740 |
| 2024 | $2,915 | $151,230 | $40,000 | $111,230 |
| 2023 | $2,915 | $151,230 | $40,000 | $111,230 |
| 2022 | $1,605 | $72,340 | $15,000 | $57,340 |
| 2021 | $1,737 | $72,340 | $15,000 | $57,340 |
| 2020 | $1,390 | $57,510 | $15,000 | $42,510 |
| 2019 | $1,469 | $57,510 | $15,000 | $42,510 |
| 2018 | $1,376 | $53,630 | $15,000 | $38,630 |
| 2017 | $1,411 | $53,630 | $15,000 | $38,630 |
| 2016 | $1,262 | $47,980 | $15,000 | $32,980 |
| 2015 | $1,236 | $47,980 | $15,000 | $32,980 |
| 2014 | $1,141 | $45,440 | $15,000 | $30,440 |
Source: Public Records
Map
Nearby Homes