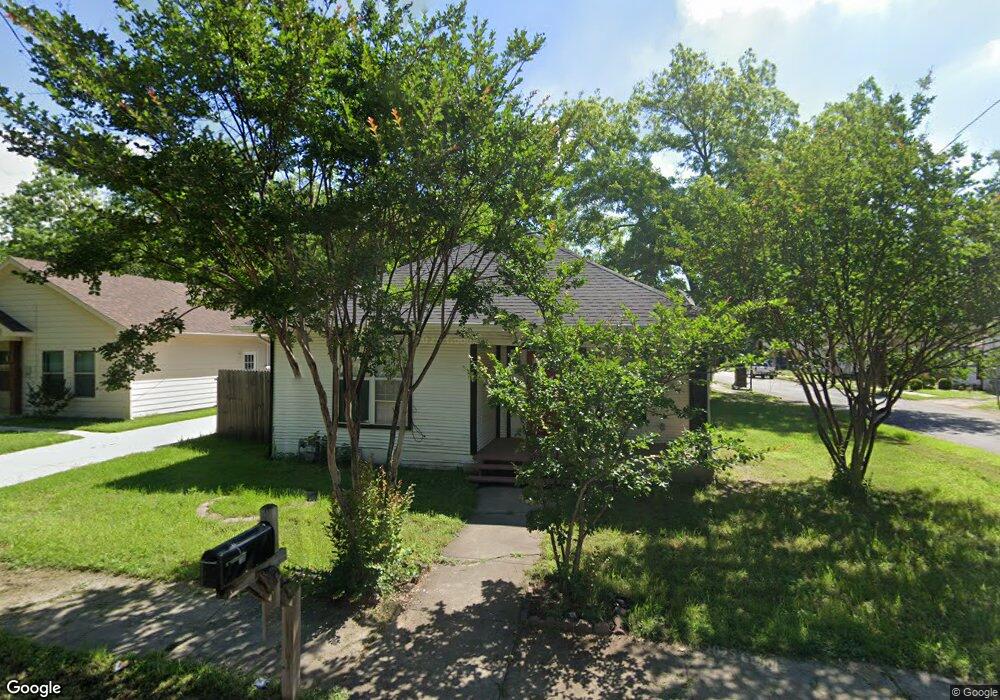
110 Harmon St Cleburne, TX 76033
Estimated Value: $156,764 - $200,000
3
Beds
1
Bath
1,148
Sq Ft
$158/Sq Ft
Est. Value
About This Home
This home is located at 110 Harmon St, Cleburne, TX 76033 and is currently estimated at $181,441, approximately $158 per square foot. 110 Harmon St is a home located in Johnson County with nearby schools including Coleman Elementary School, A.D. Wheat Middle School, and Cleburne High School.
Ownership History
Date
Name
Owned For
Owner Type
Purchase Details
Closed on
Aug 30, 2022
Sold by
Opulent Realty Llc
Bought by
Group A-Twenty One Properties Llc
Current Estimated Value
Home Financials for this Owner
Home Financials are based on the most recent Mortgage that was taken out on this home.
Original Mortgage
$1,201,600
Outstanding Balance
$1,150,604
Interest Rate
5.54%
Mortgage Type
New Conventional
Estimated Equity
-$969,163
Purchase Details
Closed on
Feb 25, 2022
Sold by
Gonzalez and Julie
Bought by
Opulent Realty Llc
Home Financials for this Owner
Home Financials are based on the most recent Mortgage that was taken out on this home.
Original Mortgage
$138,400
Interest Rate
3.55%
Mortgage Type
Construction
Purchase Details
Closed on
Jun 22, 2017
Sold by
Onderdonck Robert E and Onderdonck Christy L
Bought by
Whaley Tom and Whaley Jeanne
Purchase Details
Closed on
Jul 13, 2015
Sold by
Bufkin Richard L and Finis Lee Shipman Creditors Tr
Bought by
Mad 35 Industrial Llc
Purchase Details
Closed on
Jul 6, 2011
Sold by
Griner Rebecca Jean
Bought by
Gonzalez Homero and Gonzalez Julie
Create a Home Valuation Report for This Property
The Home Valuation Report is an in-depth analysis detailing your home's value as well as a comparison with similar homes in the area
Home Values in the Area
Average Home Value in this Area
Purchase History
| Date | Buyer | Sale Price | Title Company |
|---|---|---|---|
| Group A-Twenty One Properties Llc | -- | None Listed On Document | |
| Opulent Realty Llc | -- | Capital Title | |
| Whaley Tom | -- | None Available | |
| Mad 35 Industrial Llc | -- | Fidelity National | |
| Gonzalez Homero | -- | None Available |
Source: Public Records
Mortgage History
| Date | Status | Borrower | Loan Amount |
|---|---|---|---|
| Open | Group A-Twenty One Properties Llc | $1,201,600 | |
| Previous Owner | Opulent Realty Llc | $138,400 |
Source: Public Records
Tax History
| Year | Tax Paid | Tax Assessment Tax Assessment Total Assessment is a certain percentage of the fair market value that is determined by local assessors to be the total taxable value of land and additions on the property. | Land | Improvement |
|---|---|---|---|---|
| 2025 | $2,457 | $105,925 | $39,000 | $66,925 |
| 2024 | $2,457 | $110,196 | $39,000 | $71,196 |
| 2023 | $2,207 | $99,196 | $28,000 | $71,196 |
| 2022 | $2,483 | $99,196 | $28,000 | $71,196 |
| 2021 | $2,588 | $99,196 | $28,000 | $71,196 |
| 2020 | $1,853 | $66,878 | $20,000 | $46,878 |
| 2019 | $1,976 | $66,878 | $20,000 | $46,878 |
| 2018 | $1,165 | $39,426 | $13,000 | $26,426 |
| 2017 | $1,161 | $39,426 | $13,000 | $26,426 |
| 2016 | $1,116 | $37,926 | $11,500 | $26,426 |
Source: Public Records
Map
Nearby Homes
- 226 W Willingham St
- 217 W Heard St
- 220 W Wardville St
- 509 N Buffalo Ave
- 318 W Willingham St
- 412 W Willingham St
- 709 N Buffalo Ave
- 204 S Walnut St
- 301 Chickasaw Dr
- 8225 Farm To Market 1434
- 8256 Farm To Market 4
- 302 Featherston St
- 511 W Wilson St
- 405 College St
- 114 S Field St
- 618 Granbury St
- 108 Monroe St
- 302 S Wood St
- 504 Featherston St
- 416 N Anglin St
- 112 Harmon St
- 216 W Brown St
- 219 W Brown St
- 111 Harmon St
- 109 Harmon St
- 217 W Brown St
- 214 W Brown St
- 221 W Willingham St
- 219 W Willingham St
- 215 W Brown St
- 107 Harmon St
- 223 W Willingham St
- 217 W Willingham St
- 422 W Wardville St
- 210 W Brown St
- 308 N Walnut St
- 227 W Willingham St
- 312 N Walnut St
- 211 W Brown St
- 418 W Wardville St
Your Personal Tour Guide
Ask me questions while you tour the home.