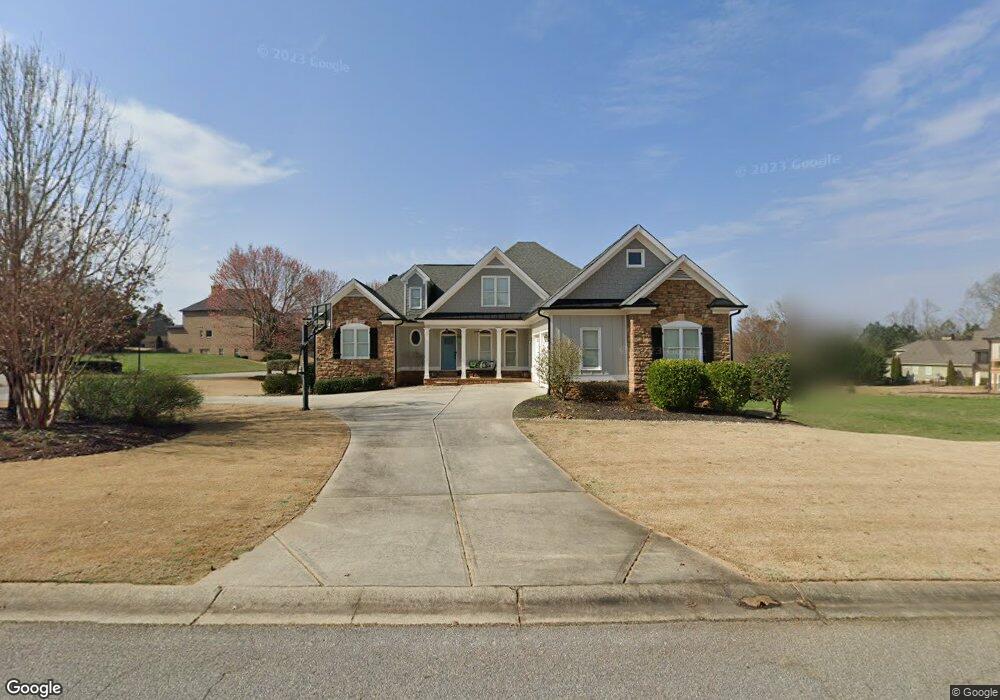
110 Harmony Grove Ln Jefferson, GA 30549
Estimated Value: $658,147 - $777,000
4
Beds
4
Baths
2,916
Sq Ft
$242/Sq Ft
Est. Value
About This Home
This home is located at 110 Harmony Grove Ln, Jefferson, GA 30549 and is currently estimated at $706,037, approximately $242 per square foot. 110 Harmony Grove Ln is a home located in Jackson County with nearby schools including Gum Springs Elementary School, West Jackson Middle School, and Jackson County High School.
Ownership History
Date
Name
Owned For
Owner Type
Purchase Details
Closed on
Jan 15, 2009
Sold by
Federal National Mortgage Association
Bought by
Lovelace Charles Randall
Current Estimated Value
Home Financials for this Owner
Home Financials are based on the most recent Mortgage that was taken out on this home.
Original Mortgage
$207,600
Outstanding Balance
$128,764
Interest Rate
5.24%
Mortgage Type
New Conventional
Estimated Equity
$577,273
Purchase Details
Closed on
May 6, 2008
Sold by
Suntrust Mtg Inc
Bought by
Federal National Mtg Associati
Purchase Details
Closed on
Apr 24, 2006
Sold by
Not Provided
Bought by
Mcdonald V Mark and Mcdonald Annette L
Home Financials for this Owner
Home Financials are based on the most recent Mortgage that was taken out on this home.
Original Mortgage
$386,100
Interest Rate
6.28%
Mortgage Type
New Conventional
Purchase Details
Closed on
Jun 5, 2003
Sold by
Bluegreen Communities
Bought by
Williams April
Create a Home Valuation Report for This Property
The Home Valuation Report is an in-depth analysis detailing your home's value as well as a comparison with similar homes in the area
Home Values in the Area
Average Home Value in this Area
Purchase History
| Date | Buyer | Sale Price | Title Company |
|---|---|---|---|
| Lovelace Charles Randall | -- | -- | |
| Federal National Mtg Associati | $409,213 | -- | |
| Suntrust Mtg Inc | $409,213 | -- | |
| Mcdonald V Mark | $98,000 | -- | |
| Williams April | $36,900 | -- |
Source: Public Records
Mortgage History
| Date | Status | Borrower | Loan Amount |
|---|---|---|---|
| Open | Lovelace Charles Randall | $207,600 | |
| Previous Owner | Mcdonald V Mark | $386,100 |
Source: Public Records
Tax History
| Year | Tax Paid | Tax Assessment Tax Assessment Total Assessment is a certain percentage of the fair market value that is determined by local assessors to be the total taxable value of land and additions on the property. | Land | Improvement |
|---|---|---|---|---|
| 2025 | $5,343 | $258,680 | $58,000 | $200,680 |
| 2024 | $5,343 | $236,680 | $36,000 | $200,680 |
| 2023 | $6,087 | $215,040 | $36,000 | $179,040 |
| 2022 | $5,095 | $177,040 | $32,400 | $144,640 |
| 2021 | $4,943 | $170,640 | $26,000 | $144,640 |
| 2020 | $4,597 | $145,320 | $26,000 | $119,320 |
| 2019 | $4,666 | $145,320 | $26,000 | $119,320 |
| 2018 | $4,533 | $139,520 | $26,000 | $113,520 |
| 2017 | $4,300 | $131,355 | $26,000 | $105,355 |
| 2016 | $4,323 | $131,355 | $26,000 | $105,355 |
| 2015 | $3,650 | $111,355 | $6,000 | $105,355 |
| 2014 | $3,302 | $100,744 | $6,000 | $94,744 |
| 2013 | -- | $100,744 | $6,000 | $94,744 |
Source: Public Records
Map
Nearby Homes
- 33 Baker Pond Ct
- 43 Baker Pond Ct
- 70 Baker Pond Ct
- 1472 Traditions Way
- 959 Old Forge Ln
- 1570 Traditions Way
- 905 Old Forge Ln
- 2046 Mill Pond Ct
- 971 Traditions Way
- 1491 Traditions Way
- 2091 Cleveland Ct
- 799 Traditions Way
- 1960 Duncans Mill Ln
- 1960 Duncans Mill Ln Unit 38N
- 1776 Traditions Way
- 1937 Duncans Mill Ln
- 1990 Duncans Mill Ln
- 315 Mews View Unit LOT 188
- 315 Mews View
- 108 Winding Ridge Trail
- 22 Harmony Grove Ln Unit 22M
- 22 Harmony Grove Ln
- 140 Harmony Grove Ln
- 10 Baker Pond Ct
- 10 Baker Pond Ct Unit M-2
- M-14 Baker Pond Ct
- M-3 Baker Pond Ct
- 111 Harmony Grove Ln
- 61 Hedge Row Ct Unit M
- 175 Harmony Grove Ln
- 95 Harmony Grove Ln
- 67 Harmony Grove Ln
- 101 Hedge Row Ct Unit M-62
- 101 Hedge Row Ct
- 180 Harmony Grove Ln
- 0 Lane Unit 7706760
- 71 Harmony Grove Ln
- 20 Baker Pond Ct
- 53 Baker Pond Ct
- M 61 Hedge Row Ct
Your Personal Tour Guide
Ask me questions while you tour the home.