Estimated Value: $72,000 - $92,000
1
Bed
1
Bath
672
Sq Ft
$122/Sq Ft
Est. Value
About This Home
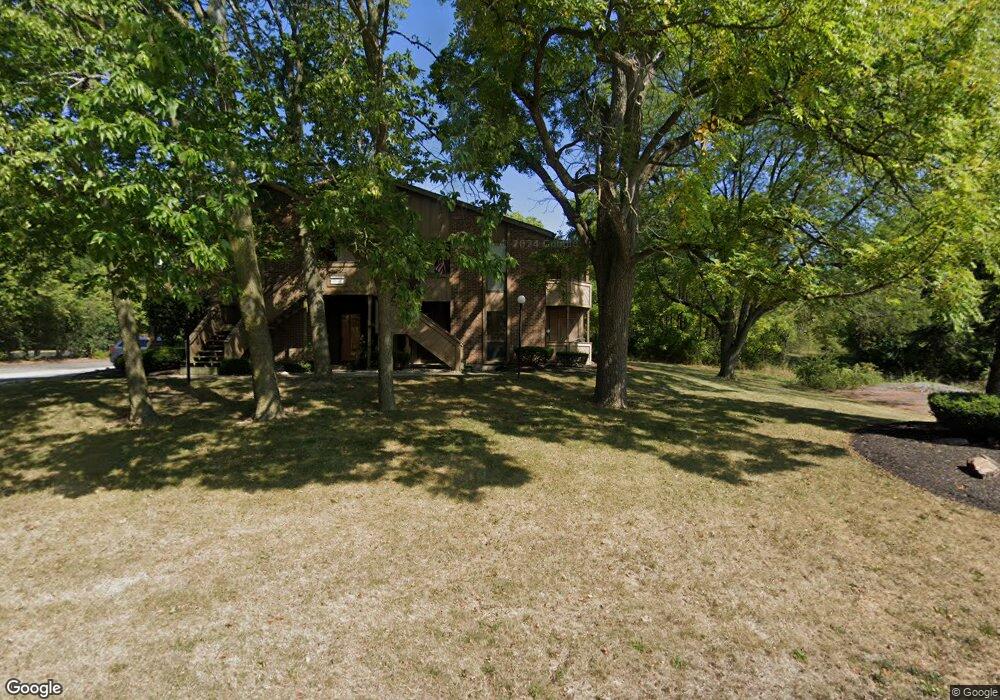
This home is located at 110 Hartford Ct Unit 6, Lima, OH 45805 and is currently estimated at $81,682, approximately $121 per square foot. 110 Hartford Ct Unit 6 is a home located in Allen County with nearby schools including Elida Elementary School, Elida Middle School, and Elida High School.
Ownership History
Date
Name
Owned For
Owner Type
Purchase Details
Closed on
Oct 8, 2021
Sold by
Kuoni Investments Llc
Bought by
Williams Brian R
Current Estimated Value
Home Financials for this Owner
Home Financials are based on the most recent Mortgage that was taken out on this home.
Original Mortgage
$48,750
Outstanding Balance
$44,455
Interest Rate
2.8%
Mortgage Type
Commercial
Estimated Equity
$37,227
Purchase Details
Closed on
Aug 4, 2017
Sold by
Aclsi Llc
Bought by
Kuoni Investments Llc
Purchase Details
Closed on
Apr 5, 2012
Sold by
Demoss Property Service Llc
Bought by
Aclsi Llc
Purchase Details
Closed on
Sep 17, 2010
Sold by
Rutter Kimberly A
Bought by
Demoss Property Service Llc
Purchase Details
Closed on
Mar 15, 2010
Sold by
Rutter Kevin G
Bought by
Rutter Kimberly A
Purchase Details
Closed on
Feb 21, 2006
Sold by
Indianbrook West Co
Bought by
Rutter Kevin G and Rutter Kimberly A
Purchase Details
Closed on
Jan 1, 1990
Bought by
Indianbrook West Co
Create a Home Valuation Report for This Property
The Home Valuation Report is an in-depth analysis detailing your home's value as well as a comparison with similar homes in the area
Home Values in the Area
Average Home Value in this Area
Purchase History
| Date | Buyer | Sale Price | Title Company |
|---|---|---|---|
| Williams Brian R | $65,000 | None Available | |
| Kuoni Investments Llc | $40,000 | None Available | |
| Aclsi Llc | -- | Attorney | |
| Demoss Property Service Llc | $45,000 | Attorney | |
| Rutter Kimberly A | -- | Attorney | |
| Rutter Kevin G | $45,000 | None Available | |
| Indianbrook West Co | -- | -- |
Source: Public Records
Mortgage History
| Date | Status | Borrower | Loan Amount |
|---|---|---|---|
| Open | Williams Brian R | $48,750 |
Source: Public Records
Tax History Compared to Growth
Tax History
| Year | Tax Paid | Tax Assessment Tax Assessment Total Assessment is a certain percentage of the fair market value that is determined by local assessors to be the total taxable value of land and additions on the property. | Land | Improvement |
|---|---|---|---|---|
| 2024 | $940 | $20,690 | $3,010 | $17,680 |
| 2023 | $859 | $16,560 | $2,420 | $14,140 |
| 2022 | $889 | $16,560 | $2,420 | $14,140 |
| 2021 | $876 | $16,560 | $2,420 | $14,140 |
| 2020 | $758 | $13,550 | $2,420 | $11,130 |
| 2019 | $758 | $13,550 | $2,420 | $11,130 |
| 2018 | $880 | $13,550 | $2,420 | $11,130 |
| 2017 | $737 | $13,030 | $2,420 | $10,610 |
| 2016 | $734 | $13,030 | $2,420 | $10,610 |
| 2015 | $747 | $13,030 | $2,420 | $10,610 |
| 2014 | $747 | $13,370 | $2,310 | $11,060 |
| 2013 | $675 | $13,370 | $2,310 | $11,060 |
Source: Public Records
Map
Nearby Homes
- 140 Hartford Ct Unit A
- 1848 Edgewood Dr
- 2268 N Glenwood Ave
- 1919 Jared Place
- 2225 N Cable Rd
- 2129 Reinell Ave
- 2275 N Cable Rd Unit 43 Unit Package
- 2275 N Cable Rd Unit 70
- 2275 N Cable Rd Unit 25
- 2275 N Cable Rd
- 2275 N Cable Rd Unit 93
- 2275 N Cable Rd Unit 178
- 2275 N Cable Rd Unit 193
- 2511 Debbie Dr
- 1619 Northbrook Dr
- 1743 Sherry Lee Dr
- 00 Homeward Ave
- 1744 Homeward Ave
- 1730 Homeward Ave
- 2630 Carolyn Dr
- 108 Hartford Ct Unit 5
- 110 Hartford Ct Unit 110 Hartford Court
- 108 Hartford Ct Unit 108
- 108 Hartford Ct
- 100 Hartford Ct
- 104 Hartford Ct
- 106 Hartford Ct Unit 106 Hartford Court
- 112 Hartford Ct
- 114 Hartford Ct
- 000 Hartford Ct
- 126 Hartford Ct
- 130 Hartford Ct
- 130 Hartford Ct Unit 130
- 116 Hartford Ct Unit 1
- 124 Hartford Ct
- 122 Hartford Ct
- 120 Hartford Ct