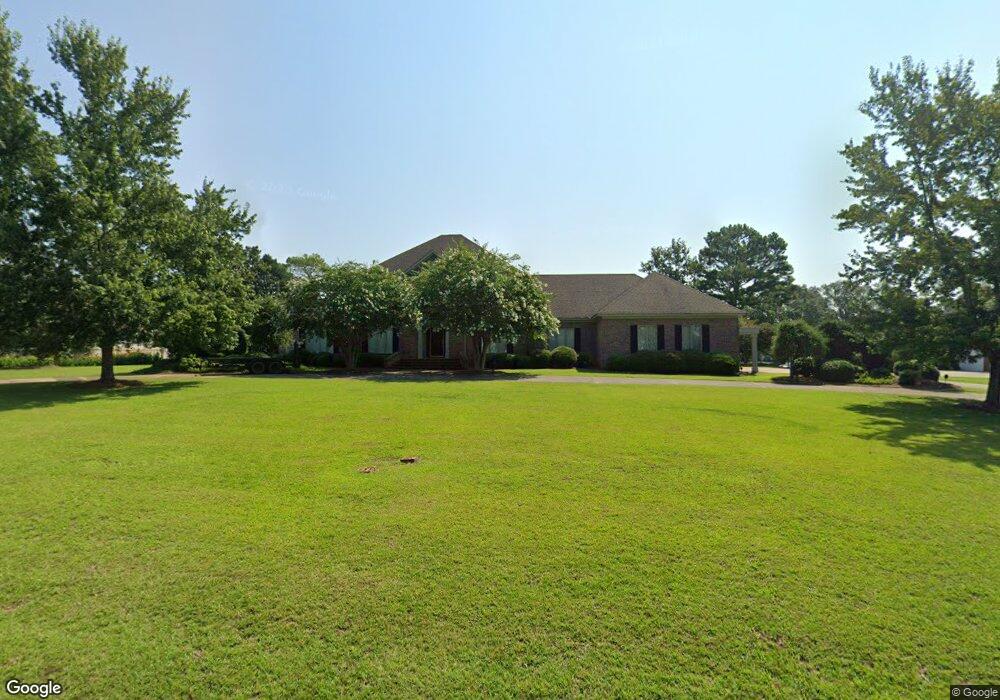
110 Hidden Lakes Dr Albany, GA 31721
Estimated Value: $504,000 - $876,000
5
Beds
5
Baths
5,788
Sq Ft
$126/Sq Ft
Est. Value
About This Home
This home is located at 110 Hidden Lakes Dr, Albany, GA 31721 and is currently estimated at $727,111, approximately $125 per square foot. 110 Hidden Lakes Dr is a home located in Dougherty County with nearby schools including Live Oak Elementary School, Merry Acres Middle School, and Westover High School.
Ownership History
Date
Name
Owned For
Owner Type
Purchase Details
Closed on
Sep 4, 2019
Sold by
Tatman John Mark
Bought by
Tatman Roxana Dehnad
Current Estimated Value
Home Financials for this Owner
Home Financials are based on the most recent Mortgage that was taken out on this home.
Original Mortgage
$565,250
Outstanding Balance
$495,115
Interest Rate
3.6%
Mortgage Type
New Conventional
Estimated Equity
$231,996
Purchase Details
Closed on
May 20, 2005
Sold by
Mcmickle Donnie L
Bought by
Hall Martha C
Purchase Details
Closed on
May 29, 2001
Sold by
Corr Corr J and Corr Terry M
Bought by
Mcmickle Donnie L
Purchase Details
Closed on
Oct 8, 1996
Sold by
Bonacum Peter J and Bonacum Carole
Bought by
Corr Corr J and Corr Terry M
Purchase Details
Closed on
Nov 4, 1991
Sold by
Boisclair Boisclair R and Boisclair Anto
Bought by
Bonacum Peter J and Bonacum Carole J
Purchase Details
Closed on
Oct 3, 1989
Sold by
Barkley Robt V
Bought by
Boisclair Robert H
Create a Home Valuation Report for This Property
The Home Valuation Report is an in-depth analysis detailing your home's value as well as a comparison with similar homes in the area
Home Values in the Area
Average Home Value in this Area
Purchase History
| Date | Buyer | Sale Price | Title Company |
|---|---|---|---|
| Tatman Roxana Dehnad | -- | -- | |
| Tatman John Mark | $595,000 | -- | |
| Hall Martha C | $565,000 | -- | |
| Mcmickle Donnie L | $482,500 | -- | |
| Corr Corr J | $380,000 | -- | |
| Bonacum Peter J | $320,000 | -- | |
| Boisclair Robert H | $45,000 | -- |
Source: Public Records
Mortgage History
| Date | Status | Borrower | Loan Amount |
|---|---|---|---|
| Open | Tatman John Mark | $565,250 | |
| Closed | Tatman Roxana Dehnad | $565,250 |
Source: Public Records
Tax History Compared to Growth
Tax History
| Year | Tax Paid | Tax Assessment Tax Assessment Total Assessment is a certain percentage of the fair market value that is determined by local assessors to be the total taxable value of land and additions on the property. | Land | Improvement |
|---|---|---|---|---|
| 2024 | $9,236 | $201,880 | $22,800 | $179,080 |
| 2023 | $8,409 | $201,880 | $22,800 | $179,080 |
| 2022 | $9,262 | $201,880 | $22,800 | $179,080 |
| 2021 | $8,574 | $201,880 | $22,800 | $179,080 |
| 2020 | $7,286 | $201,880 | $22,800 | $179,080 |
| 2019 | $7,666 | $180,000 | $22,800 | $157,200 |
| 2018 | $7,685 | $180,000 | $22,800 | $157,200 |
| 2017 | $7,151 | $180,000 | $22,800 | $157,200 |
| 2016 | $7,157 | $180,000 | $22,800 | $157,200 |
| 2015 | -- | $180,000 | $22,800 | $157,200 |
| 2014 | $7,069 | $180,000 | $22,800 | $157,200 |
Source: Public Records
Map
Nearby Homes
- 4802 Grandview Dr
- 4800 Grandview Dr
- Lot 15 Grandview Dr
- Lot 17 Grandview Dr
- Lot 16 Grandview Dr
- 5100 Shiloh Ct
- 100 Everton Ct
- 5102 Shiloh Ct
- 305 Hidden Lakes Dr
- 203 Manchester Dr
- 124 Byron Ridge Dr
- 321 Hidden Lakes Dr
- 301 Hidden Lakes Dr
- Lot 10 Hidden Lakes Dr
- Lot 7 Hidden Lakes Dr
- Lot 6 Hidden Lakes Dr
- Lot 14 Hidden Lakes Dr
- Lot 11 Hidden Lakes Dr
- 112 Eight Mile Rd
- 120 Byron Plantation Rd
- 108 Hidden Lakes Dr
- 112 Hidden Lakes Dr
- 111 Hidden Lakes Dr
- 0 Barrington Dr Unit 7636722
- 0 Barrington Dr Unit 7348980
- 0 Barrington Dr
- 109 Hidden Lakes Dr
- 113 Hidden Lakes Dr
- 106 Hidden Lakes Dr
- 5002 Barrington Dr
- 4804 Grandview Dr
- 104 Hidden Lakes Dr
- 107 Hidden Lakes Dr
- 4902 Grandview Dr
- 4806 Grandview Dr
- 5005 Barrington Dr
- 5004 Barrington Dr
- 4929 Grandview Dr
- 105 Hidden Lakes Dr
- 4906 Grandview Dr