110 High St Canton, NC 28716
Estimated Value: $373,000 - $421,000
3
Beds
2
Baths
1,561
Sq Ft
$253/Sq Ft
Est. Value
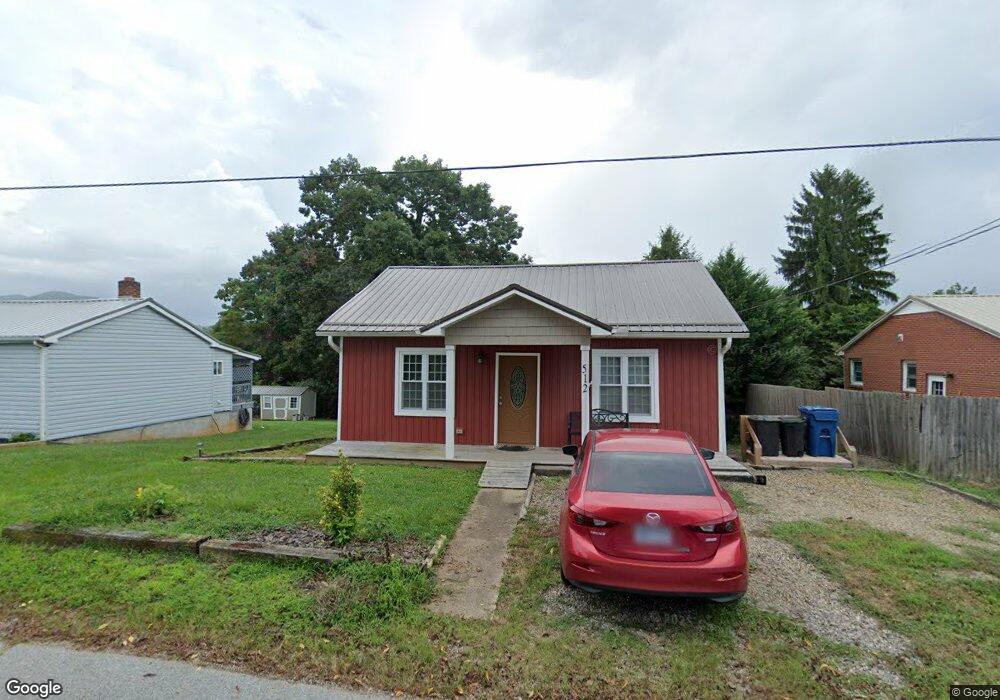
About This Home
This home is located at 110 High St, Canton, NC 28716 and is currently estimated at $395,430, approximately $253 per square foot. 110 High St is a home located in Haywood County with nearby schools including North Canton Elementary School, Canton Middle, and Pisgah High School.
Ownership History
Date
Name
Owned For
Owner Type
Purchase Details
Closed on
Dec 21, 2017
Sold by
Seay Kayla Presley and Pressley Kayla Elizabeth
Bought by
Donoughe Kyle Evan
Current Estimated Value
Home Financials for this Owner
Home Financials are based on the most recent Mortgage that was taken out on this home.
Original Mortgage
$201,286
Outstanding Balance
$169,158
Interest Rate
3.87%
Mortgage Type
FHA
Estimated Equity
$226,272
Purchase Details
Closed on
Aug 24, 2015
Sold by
Equity Trust Co
Bought by
Pressley Kayla Elizabeth and Seay Heath Lee
Home Financials for this Owner
Home Financials are based on the most recent Mortgage that was taken out on this home.
Original Mortgage
$160,000
Interest Rate
4.5%
Mortgage Type
Adjustable Rate Mortgage/ARM
Purchase Details
Closed on
Feb 26, 2015
Sold by
Hyatt Jason A and Hyatt Kerrie
Bought by
Equity Trust Co
Purchase Details
Closed on
Oct 20, 2004
Bought by
Hyatt Jason Alexander
Create a Home Valuation Report for This Property
The Home Valuation Report is an in-depth analysis detailing your home's value as well as a comparison with similar homes in the area
Home Values in the Area
Average Home Value in this Area
Purchase History
| Date | Buyer | Sale Price | Title Company |
|---|---|---|---|
| Donoughe Kyle Evan | $205,000 | None Available | |
| Pressley Kayla Elizabeth | $166,500 | Attorney | |
| Equity Trust Co | $116,563 | None Available | |
| Hyatt Jason Alexander | -- | -- |
Source: Public Records
Mortgage History
| Date | Status | Borrower | Loan Amount |
|---|---|---|---|
| Open | Donoughe Kyle Evan | $201,286 | |
| Previous Owner | Pressley Kayla Elizabeth | $160,000 |
Source: Public Records
Tax History
| Year | Tax Paid | Tax Assessment Tax Assessment Total Assessment is a certain percentage of the fair market value that is determined by local assessors to be the total taxable value of land and additions on the property. | Land | Improvement |
|---|---|---|---|---|
| 2025 | -- | $252,100 | $28,800 | $223,300 |
| 2024 | $15 | $252,100 | $28,800 | $223,300 |
| 2023 | $1,546 | $252,100 | $28,800 | $223,300 |
| 2022 | $1,508 | $252,100 | $28,800 | $223,300 |
| 2021 | $1,508 | $252,100 | $28,800 | $223,300 |
| 2020 | $1,244 | $185,500 | $28,800 | $156,700 |
| 2019 | $1,249 | $185,500 | $28,800 | $156,700 |
| 2018 | $1,249 | $185,500 | $28,800 | $156,700 |
| 2017 | $1,249 | $185,500 | $0 | $0 |
| 2016 | $1,228 | $187,900 | $0 | $0 |
| 2015 | $1,228 | $187,900 | $0 | $0 |
| 2014 | $1,109 | $187,900 | $0 | $0 |
Source: Public Records
Map
Nearby Homes
- 3 Elizabeth St
- 622 N Main St
- 412 Trammell Ave
- 99999 Allen St
- 761 N Main St
- 223 N Main St
- 28 Plemmons St
- 83 Flint St
- 118 Mitchell St
- 62 Mitchell St
- 112 Hy Vu Dr
- 91 Star Ridge Rd
- 284 Northridge Dr
- 13 Eastwood Dr
- 1389 Newfound Rd
- 00 Beaverdam Rd
- 318 Academy St
- 606 Oakmont Dr
- 57 Fiddle Dr
- 195 Terrace Dr
Your Personal Tour Guide
Ask me questions while you tour the home.