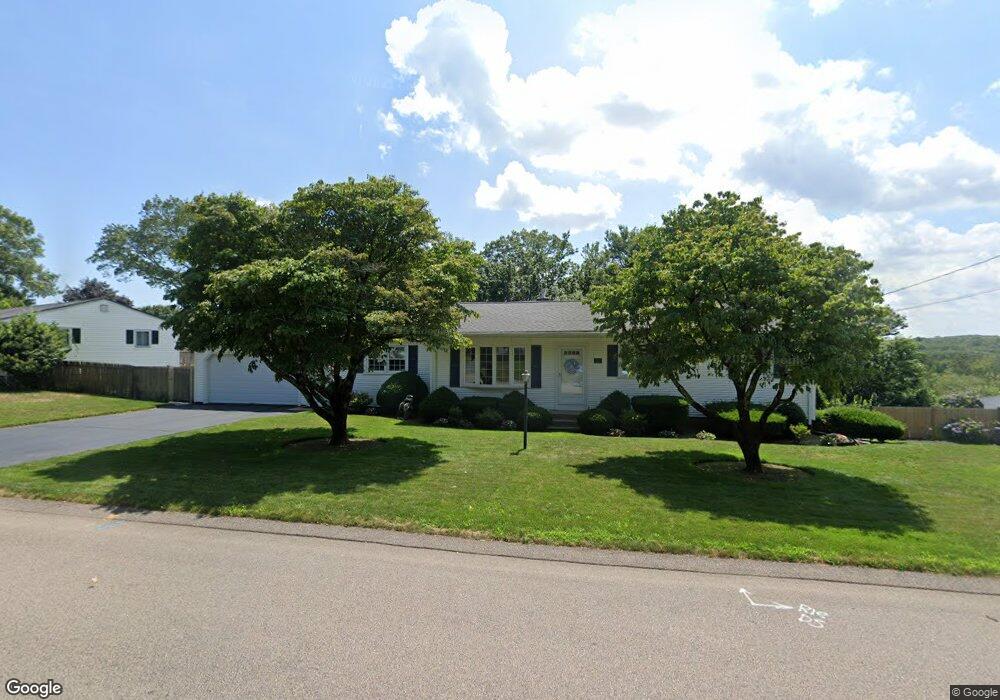
110 Hilton Rd Warwick, RI 02889
Hoxie NeighborhoodEstimated Value: $444,000 - $469,000
3
Beds
2
Baths
1,316
Sq Ft
$343/Sq Ft
Est. Value
About This Home
This home is located at 110 Hilton Rd, Warwick, RI 02889 and is currently estimated at $451,138, approximately $342 per square foot. 110 Hilton Rd is a home located in Kent County with nearby schools including Saint Kevin School and Bishop Hendricken High School.
Ownership History
Date
Name
Owned For
Owner Type
Purchase Details
Closed on
Jun 18, 2014
Sold by
Cornwell Robert A and Cornwell Lucia J
Bought by
Cornwell Robert A and Cornwell Lucia J
Current Estimated Value
Purchase Details
Closed on
May 28, 2014
Sold by
Cornwell Robert A and Cornwell Lucia J
Bought by
Cornwell Robert A and Cornwell Lucia J
Create a Home Valuation Report for This Property
The Home Valuation Report is an in-depth analysis detailing your home's value as well as a comparison with similar homes in the area
Home Values in the Area
Average Home Value in this Area
Purchase History
| Date | Buyer | Sale Price | Title Company |
|---|---|---|---|
| Cornwell Robert A | -- | -- | |
| Cornwell Robert A | -- | -- | |
| Cornwell Robert A | -- | -- |
Source: Public Records
Mortgage History
| Date | Status | Borrower | Loan Amount |
|---|---|---|---|
| Previous Owner | Cornwell Robert A | $100,000 | |
| Previous Owner | Cornwell Robert A | $93,000 |
Source: Public Records
Tax History
| Year | Tax Paid | Tax Assessment Tax Assessment Total Assessment is a certain percentage of the fair market value that is determined by local assessors to be the total taxable value of land and additions on the property. | Land | Improvement |
|---|---|---|---|---|
| 2025 | $5,316 | $418,600 | $120,100 | $298,500 |
| 2024 | $5,135 | $354,900 | $99,100 | $255,800 |
| 2023 | $5,036 | $354,900 | $99,100 | $255,800 |
| 2022 | $5,027 | $268,400 | $80,000 | $188,400 |
| 2021 | $5,027 | $268,400 | $80,000 | $188,400 |
| 2020 | $5,027 | $268,400 | $80,000 | $188,400 |
| 2019 | $5,027 | $268,400 | $80,000 | $188,400 |
| 2018 | $4,328 | $208,100 | $71,600 | $136,500 |
| 2017 | $4,212 | $208,100 | $71,600 | $136,500 |
| 2016 | $4,212 | $208,100 | $71,600 | $136,500 |
| 2015 | $4,096 | $197,400 | $76,300 | $121,100 |
| 2014 | $3,960 | $197,400 | $76,300 | $121,100 |
| 2013 | $3,907 | $197,400 | $76,300 | $121,100 |
Source: Public Records
Map
Nearby Homes
- 38 Bowman Dr
- 207 Stillwater Dr
- 54 Ansonia Rd
- 0 Bethel St
- 18 Sevilla Ave
- 700 Sandy Ln Unit 16
- 700 Sandy Ln Unit 3
- 700 Sandy Ln Unit 5
- 700 Sandy Ln Unit 19
- 700 Sandy Ln Unit 4
- 700 Sandy Ln Unit 20
- 700 Sandy Ln Unit 2
- 108 Fern St
- 64 Ormsby Ave
- 211 Pinnery Ave
- 44 Woodstock Dr
- 48 Rowe Ave
- 112 Old Warwick Ave
- 21 Sarah Ln
- 28 Hoyt St
Your Personal Tour Guide
Ask me questions while you tour the home.