
Seller's Agent in 2025
Joyce Lebedew
Joyce Lebedew Real Estate
(617) 594-1449
96 in this area
101 Total Sales
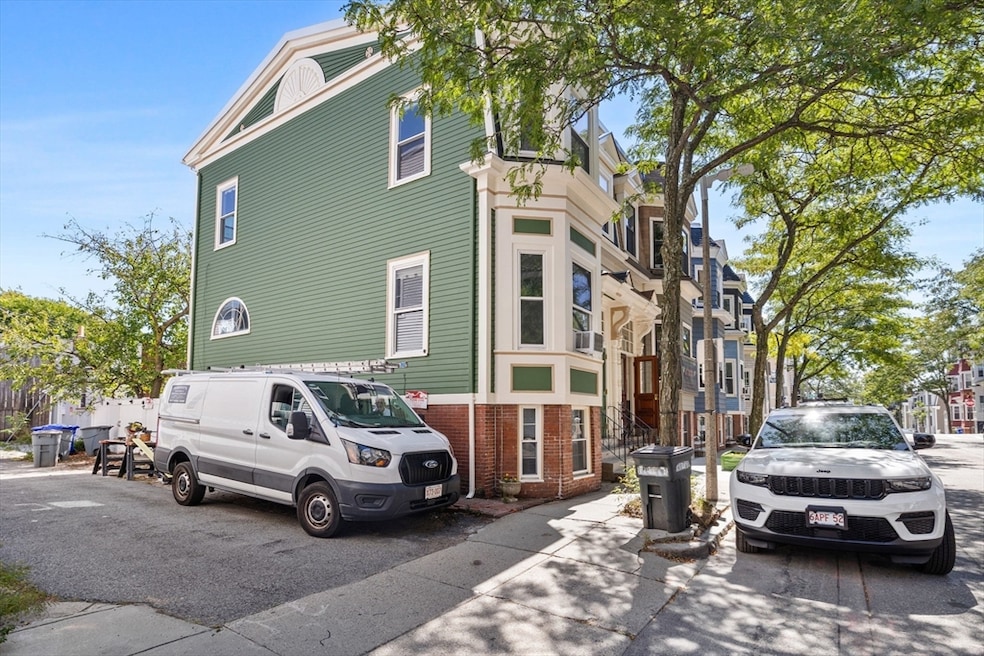
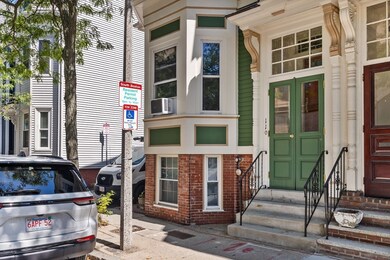
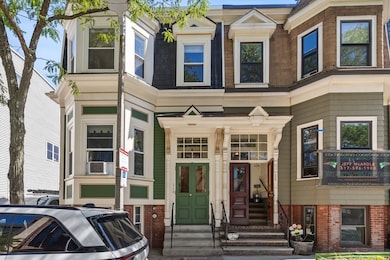
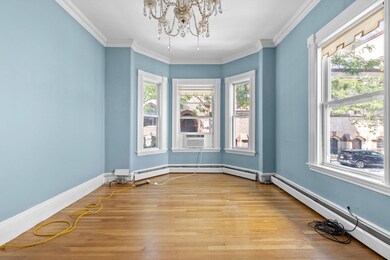
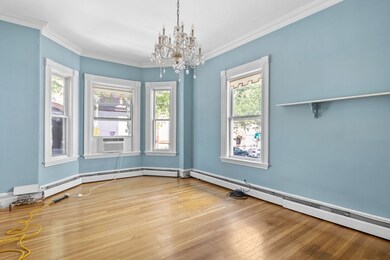
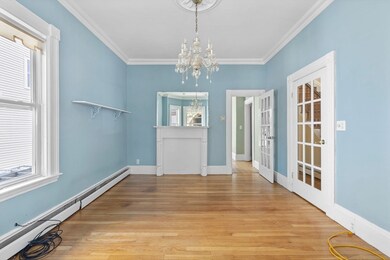
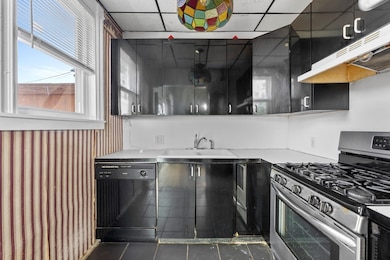
PREMIER EAST SIDE SINGLE FAMILY ON PRIVATE WAY WITH DESIGNATED PARKING. THE PROPERTY FEATURES A TRANSITIONAL FLOOR PLAN, LARGE BEDROOMS AND A MASSIVE FRONT FACING LIVING ROOM WITH BOW FRONT WINDOWS FACING BEAUTIFUL AND HISTORIC GATE OF HEAVEN CHURCH.NEWLY UPDATED BATHROOMS WITH GRANITE AND QUARTZ, AND POLISHED FITTINGS. BASEMENT OFFERS EXCELLENT EXPANSION POTENTIAL. ADDITIONAL FEATURES INCLUDE LAUNDRY, HARDWOOD FLOORS, CROWN MOLDING, MULTIPLE EXPOSURES PROVIDING INCREDIBLE NATURAL LIGHT, AND TWO OUTDOOR SPACES CONSISTING OF A DECK AND YARD. IDEALLY SITUATED ALONG THE BUS ROUTE, JUST ONE BLOCK TO EAST BROADWAY AND THREE BLOCKS TO THE OCEAN.
| Date | Type | Sale Price | Title Company |
|---|---|---|---|
| Quit Claim Deed | $950,000 | -- | |
| Quit Claim Deed | -- | None Available | |
| Quit Claim Deed | -- | None Available | |
| Quit Claim Deed | $566,375 | -- | |
| Quit Claim Deed | $566,375 | -- | |
| Land Court Massachusetts | -- | -- | |
| Land Court Massachusetts | -- | -- |
| Date | Status | Loan Amount | Loan Type |
|---|---|---|---|
| Open | $760,000 | New Conventional | |
| Previous Owner | $530,000 | New Conventional | |
| Previous Owner | $453,100 | New Conventional | |
| Previous Owner | $111,000 | No Value Available | |
| Previous Owner | $100,000 | No Value Available |
| Date | Event | Price | List to Sale | Price per Sq Ft |
|---|---|---|---|---|
| 11/05/2025 11/05/25 | Sold | $950,000 | -13.6% | $747 / Sq Ft |
| 09/23/2025 09/23/25 | Pending | -- | -- | -- |
| 09/09/2025 09/09/25 | For Sale | $1,099,000 | -- | $864 / Sq Ft |
| Year | Tax Paid | Tax Assessment Tax Assessment Total Assessment is a certain percentage of the fair market value that is determined by local assessors to be the total taxable value of land and additions on the property. | Land | Improvement |
|---|---|---|---|---|
| 2025 | $10,688 | $923,000 | $296,100 | $626,900 |
| 2024 | $9,880 | $906,400 | $263,400 | $643,000 |
| 2023 | $9,011 | $839,000 | $243,800 | $595,200 |
| 2022 | $8,299 | $762,800 | $221,700 | $541,100 |
| 2021 | $7,902 | $740,600 | $215,200 | $525,400 |
| 2020 | $6,977 | $660,700 | $202,800 | $457,900 |
| 2019 | $6,631 | $629,100 | $159,200 | $469,900 |
| 2018 | $6,164 | $588,200 | $159,200 | $429,000 |
| 2017 | $5,931 | $560,100 | $159,200 | $400,900 |
| 2016 | $5,706 | $518,700 | $159,200 | $359,500 |
| 2015 | $5,767 | $476,200 | $151,000 | $325,200 |
| 2014 | $5,242 | $416,700 | $151,000 | $265,700 |
Seller's Agent in 2025
Joyce Lebedew
Joyce Lebedew Real Estate
(617) 594-1449
96 in this area
101 Total Sales
Source: MLS Property Information Network (MLS PIN)
MLS Number: 73427919
APN: SBOS-000000-000006-002239
Disclaimer: Certain information contained herein is derived from information provided by parties other than Homes.com. All information provided is deemed reliable, but is not guaranteed to be accurate and should be independently verified.
![]() The property listing data and information, or the Images, set forth herein were provided to MLS Property Information Network, Inc. from third party sources, including sellers, lessors and public records, and were compiled by MLS Property Information Network, Inc. The property listing data and information, and the Images, are for the personal, non-commercial use of consumers having a good faith interest in purchasing or leasing listed properties of the type displayed to them and may not be used for any purpose other than to identify prospective properties which such consumers may have a good faith interest in purchasing or leasing. MLS Property Information Network, Inc. and its subscribers disclaim any and all representations and warranties as to the accuracy of the property listing data and information, or as to the accuracy of any of the Images, set forth herein.
The property listing data and information, or the Images, set forth herein were provided to MLS Property Information Network, Inc. from third party sources, including sellers, lessors and public records, and were compiled by MLS Property Information Network, Inc. The property listing data and information, and the Images, are for the personal, non-commercial use of consumers having a good faith interest in purchasing or leasing listed properties of the type displayed to them and may not be used for any purpose other than to identify prospective properties which such consumers may have a good faith interest in purchasing or leasing. MLS Property Information Network, Inc. and its subscribers disclaim any and all representations and warranties as to the accuracy of the property listing data and information, or as to the accuracy of any of the Images, set forth herein.
Ask me questions while you tour the home.